Graphing Quadratic Equations Study Guide

Quadratic functions involve a variable being squared. The graphs of quadratic functions are parabolas that are usually transformed versions of the basic equation
Quadratic Function: A nonlinear function that can be written as
Parabola: The U-shaped graph formed by a quadratic function.
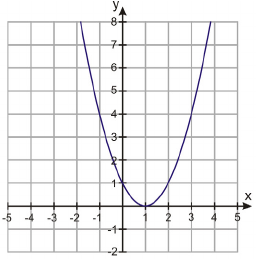
Vertex: The lowest or highest point on the parabola.
Axis of Symmetry: The vertical line that divides the parabola into two symmetric parts (mirror images).
x-Intercept: The point where a line crosses the x-axis.
Quadratic Equation: A nonlinear equation that can be written as
Root (of a polynomial): The value that makes the polynomial equal to
Zero (of a function): The value that makes the function equal to
The standard form of a quadratic function:
When graphed, all quadratic functions are parabolas. The values of
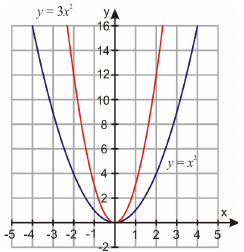


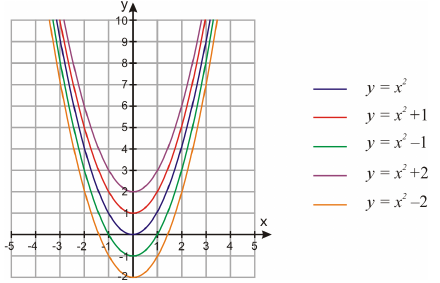

The most straightforward way to graph quadratic functions is to make a table of values, plot them, then connect the points with a smooth curve.
Another way to graph quadratic functions is to rewrite the function in the intercept form.
The intercept form is just the factored form of the quadratic function.
The intercept form is useful because it tells us:
With these points, we can draw the parabola.

Knowing the x-intercepts and one other point on the parabola, we can also write the quadratic function for the parabola.
Finding the roots or zeroes of a quadratic equation is the same as solving the quadratic equation; we want to find the values of
A quadratic equation is the same as a quadratic function where
The x-intercepts can be found by factoring the equation (rewritten in the intercept form) or by graphing.
Looking at the graph tells us the number of solutions to the quadratic equation.