
Graphs of Rational Functions Study Guide

Rational functions refer to any ratio of two polynomials. Graphs of rational functions are a way to visually represent equations where the variables are directly, inversely, or jointly related to one another.
Variation: Equation that relates a variable to one or more other variables by multiplication and division.
Direct Variation: Related variables increase or decrease together at a steady rate.
Inverse Variation: When one variable increases, the other decreases, and vice versa.
Joint Variation: One variable varies as a product of two or more variables.
Asymptote: Values that a function approaches but never reaches.
General equations for different types of variations:
An equation can show one, two, or all three types of variations. A equation with all three types of variation shows combined variation.
Graphing rational functions is not that different from graphing other types of equations, except we have to consider asymptotes.
Direct and inverse variations have very different looking graphs.


Vertical asymptotes (or x-asymptotes) are found at the values of
If
Horizontal asymptote (or y-asymptote) is the value that
Example: Consider
We can see that the first terms in the numerator and the denominator are much bigger than the other terms. The horizontal asymptote is
Example: Now consider
The first term in the denominator is much bigger than the first term in the numerator. The horizontal asymptote is
Example:
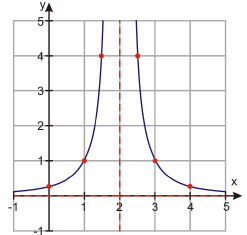
Graph
To find the vertical asymptote, set the denominator equal to zero:
and
Graph all of the asymptotes first (the red dotted lines). The rest is like graphing anyother equation. Create a table of values and plot the points. Make sure to includepoints near the vertical asymptotes!
