Systems of Linear Inequalities Study Guide

One way to solve systems of linear equalities is to graph the inequalities and see if there are any areas on the graph where the inequalities overlap. The places where the inequalities’ graphs overlap are the solutions to the system.
Linear Inequality: A linear equation with the
Absolute Value: The absolute value of a number is the distance of that number from
A linear equation in slope-intercept form is
To draw a linear inequality,

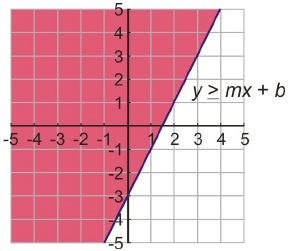
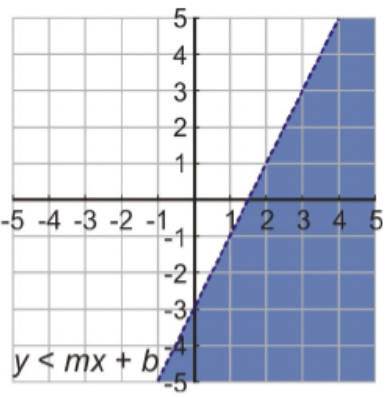

Test a point on one side of the line (not on the line) to see if the point makes the inequality true. If it does,shade that side of the line. If not, shade the other side.
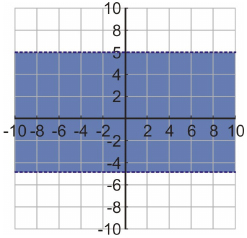
Linear inequalities in one variable can also be graphed on the coordinate plane. The line that gets drawn is a horizontal or vertical line. The graph looks like the solution graphed on the number line but stretched vertically.
Example:


A system of linear inequalities can be solved by graphing.
The solutions of two linear inequalities are unbounded regions, which continue infinitely in at least one direction. Here are two examples:

Test a point on one side of the line (not on the line) to see if the point makes the inequality true. If it does,shade that side of the line. If not, shade the other side.

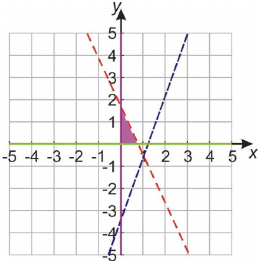
The solutions of two linear inequalities can be unbounded or bounded regions. A bounded region is a finite region with three or more sides.
Example:
Absolute value inequalities can be re-written as a system of two inequalities.
Example:
Rewrite as

Example:
Rewrite as