What can a weather map tell you about the weather?
A lot! A weather map indicates all sorts of things to let you know the forecast. It also may have some cute graphics associated with it.
Weather Maps
Weather maps simply and graphically depict meteorological conditions in the atmosphere. Weather maps may display only one feature of the atmosphere or multiple features. They can depict information from computer models or from human observations.
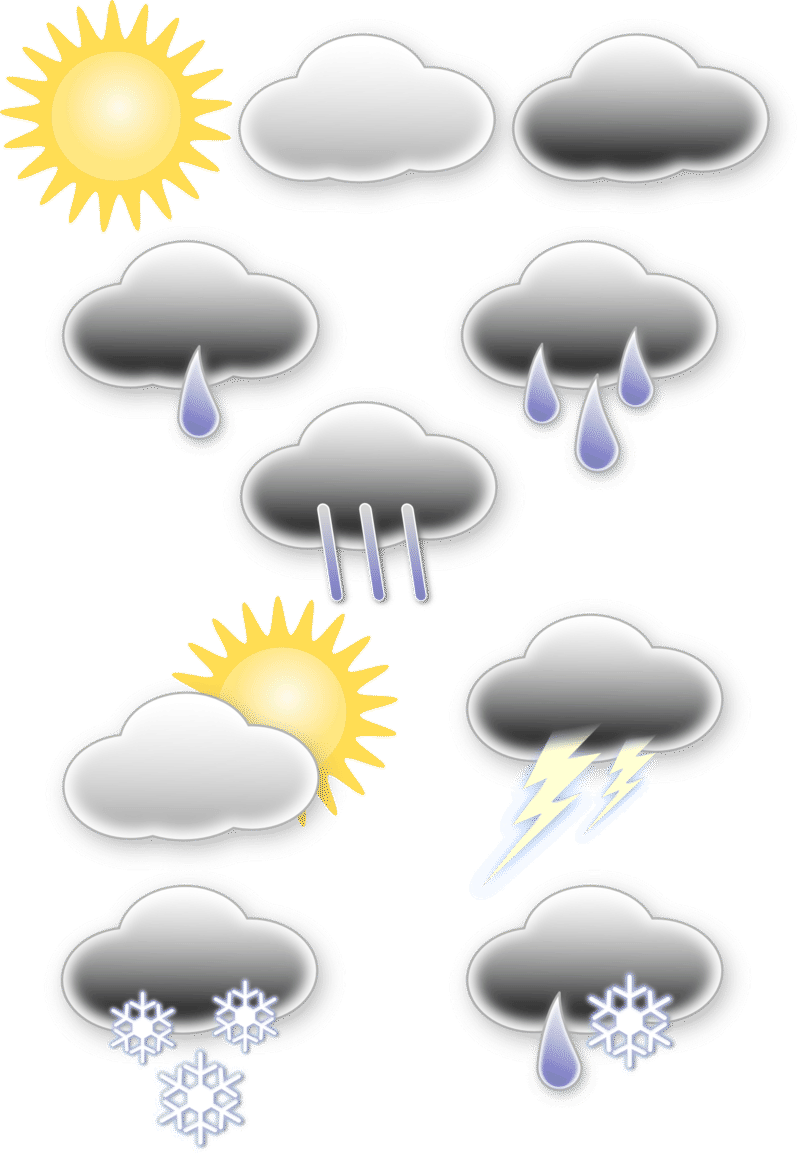
On a weather map, important meteorological conditions are plotted for each weather station. Meteorologists use many different symbols as a quick and easy way to display information on the map (Figurebelow).
Explanation of some symbols that may appear on a weather map.
Once conditions have been plotted, points of equal value can be connected by isolines. Weather maps can have many types of connecting lines. For example:
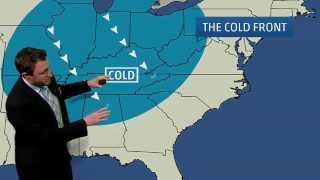
Lines of equal temperature are called isotherms. Isotherms show temperature gradients and can indicate the location of a front. In terms of precipitation, what does the 0oC (32oF) isotherm show?
Isobars are lines of equal average air pressure at sea level (Figurebelow). Closed isobars represent the locations of high and low pressure cells.
Isobars can be used to help visualize high pressure (H) and low pressure (L) cells.
Isotachs are lines of constant wind speed. Where the minimum values occur high in the atmosphere, tropical cyclones may develop. The highest wind speeds can be used to locate the jet stream.
Surface weather analysis maps are weather maps that only show conditions on the ground (Figurebelow).
Surface analysis maps may show sea level mean pressure, temperature, and amount of cloud cover.


 FlexiA FREE Digital Tutor for Every Student
 FlexBooks 2.0Customizable, digital textbooks in a new, interactive platform
 FlexBooksCustomizable, digital textbooks
 SchoolsFlexBooks from schools and districts near you
 Study GuidesQuick review with key information for each concept
 Adaptive PracticeBuilding knowledge at each student’s skill level
 SimulationsInteractive Physics & Chemistry Simulations
 PLIXPlay. Learn. Interact. eXplore.
 CCSS MathConcepts and FlexBooks aligned to Common Core
 NGSSConcepts aligned to Next Generation Science Standards
 Certified EducatorStand out as an educator. Become CK-12 Certified.
 WebinarsLive and archived sessions to learn about CK-12