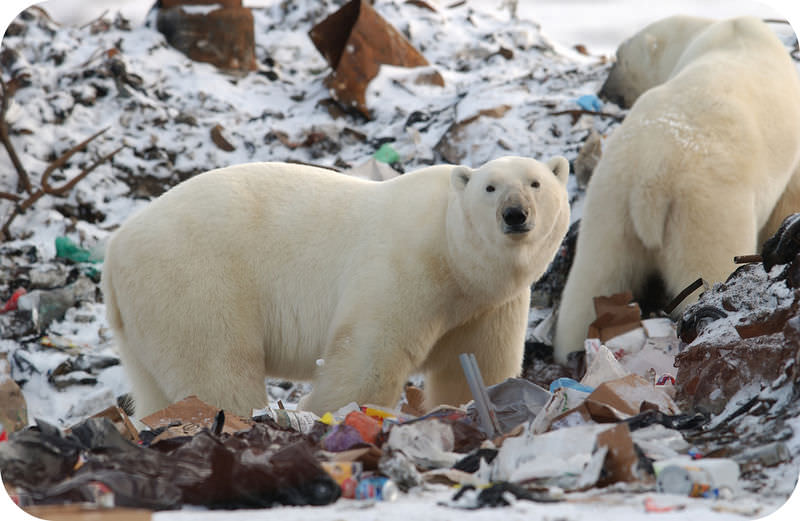
Changes due to warmer temperatures are becoming more visible. The Arctic is covered with ice less of the year, so polar bears can't hunt and are raiding garbage dumps for food. Extreme weather events are becoming more common as weather becomes stranger. Sea level is rising, which is a problem during storms.
Global Warming
With more greenhouse gases trapping heat, average annual global temperatures are rising. This is known as global warming.
Increasing Temperatures
While temperatures have risen since the end of the Pleistocene, 10,000 years ago, this rate of increase has been more rapid in the past century, and has risen even faster since 1990. The 10 warmest years in the 134-year record have all occurred in the 21st century. The warmest year on record was 2016, with 2015 and 2014 being the second and third warmest (through 2016) (Figurebelow). People who are younger than 30, have never experienced a month in which Earth’s average surface temperature was below average for that month during the 20th century. The last time global temperatures were below that average was in February 1985. (Figurebelow).
Recent temperature increases show how much temperature has risen since the Industrial Revolution began.
Annual variations aside, the average global temperature increased about 01.0°C (1.8°F) between 1880 and 2015, according to the Goddard Institute for Space Studies, NASA. This number doesn’t seem very large. Why is it important?
Greenhouse Gas Emissions
The United States has long been the largest emitter of greenhouse gases, with about 20% of total emissions in 2004. As a result of China’s rapid economic growth, its emissions surpassed those of the United States in 2008. However, it’s also important to keep in mind that the United States has only about one-fifth the population of China. What’s the significance of this? The average United States citizen produces far more greenhouse gas emissions than the average Chinese person.
Changes Due to Warming Temperatures
The following images show changes in the Earth and organisms as a result of global warming: Figurebelow, Figurebelow, Figurebelow.
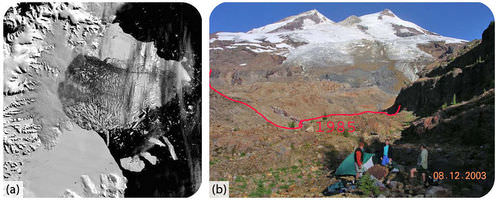
(a) Breakup of the Larsen Ice Shelf in Antarctica in 2002 was related to climate warming in the region. (b) The Boulder Glacier has melted back tremendously since 1985. Other mountain glaciers around the world are also melting.
Permafrost is melting and its extent decreasing. There are now fewer summer lakes in Siberia.
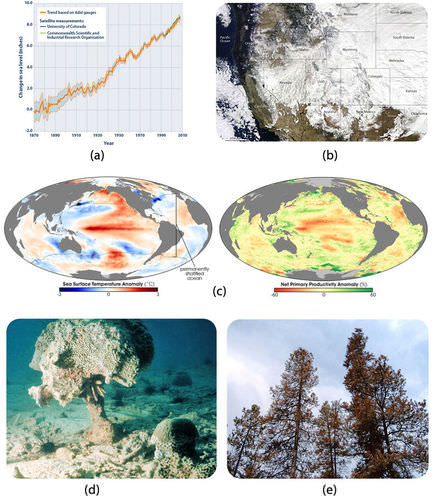
(a) Melting ice caps add water to the oceans, so sea level is rising. Remember that water slightly expands as it warms — this expansion is also causing sea level to rise. (b) Weather is becoming more variable with more severe storms and droughts. Snow blanketed the western United States in December 2009. (c) As surface seas warm, phytoplankton productivity has decreased. (d) Coral reefs are dying worldwide; corals that are stressed by high temperatures turn white. (e) Pine beetle infestations have killed trees in western North America The insects have expanded their ranges into areas that were once too cold.
The timing of events for species is changing. Mating and migrations take place earlier in the spring months. Species that can are moving their ranges uphill. Some regions that were already marginal for agriculture are no longer arable because they have become too warm or dry.
What are the two major effects being seen in this animation? Glaciers are melting and vegetation zones are moving uphill. If fossil fuel use exploded in the 1950s, why do these changes begin early in the animation? Does this mean that the climate change we are seeing is caused by natural processes and not by fossil fuel use?
Warming temperatures are bringing changes to much of the planet, including California. Sea level is rising, snow pack is changing, and the ecology of the state is responding to these changes.
Summary
Greenhouse gases trap heat in the atmosphere; burning fossil fuels and other human activities release greenhouse gases into the atmosphere; greenhouse gas levels in the atmosphere are increasing; and global temperatures are increasing.
Average global temperature has been rising since the end of the ice ages but the rate of its rise has increased in recent decades.
Changes due to increasing temperatures are seen around the globe but are most dramatic in the polar regions.
Review
The first point in the summary above is a set of facts. Does it logically follow that human activities are causing global temperatures to rise? Is there a different explanation that fits with the facts?
Why is average global temperature the most important value when talking about climate change?
What are some of the effects of climate change that are already being seen?
Explore More
Use the resource below to answer the questions that follow.
How much has the global temperature risen in the last century?
What is the major human activity that contributes to global warming and why?
What is the greenhouse effect?
Is average global temperature rising? What is your evidence?
Which greenhouse gases are at their highest levels in history? When was the last time they were as high?
What do researchers predict will happen?
What can we do now to slow the rise in temperatures?
Resources
NOTES / HIGHLIGHTS
Please Sign In to create your own Highlights / Notes
Vocabulary
termdefinition
global warmingworldwide increase in Earth’s average surface temperature caused by the addition of greenhouse gases to the atmosphere due to human actions.
Notes/Highlights
Color
Highlighted Text
Notes
Please Sign In to create your own Highlights / Notes
Credit:(a) Courtesy of Ted Scambos, National Snow and Ice Data Center, NASA's Earth Observatory; (b) User:Peltoms/Wikipedia Source: (a) http://earthobservatory.nasa.gov/IOTD/view.php?id=2288(b) http://commons.wikimedia.org/wiki/File:Bouldert.jpg License:(a) Public Domain; (b) The copyright holder of this work allows anyone to use it for any purpose including unrestricted redistribution, commercial use, and modification


 FlexiA FREE Digital Tutor for Every Student
 FlexBooks 2.0Customizable, digital textbooks in a new, interactive platform
 FlexBooksCustomizable, digital textbooks
 SchoolsFlexBooks from schools and districts near you
 Study GuidesQuick review with key information for each concept
 Adaptive PracticeBuilding knowledge at each student’s skill level
 SimulationsInteractive Physics & Chemistry Simulations
 PLIXPlay. Learn. Interact. eXplore.
 CCSS MathConcepts and FlexBooks aligned to Common Core
 NGSSConcepts aligned to Next Generation Science Standards
 Certified EducatorStand out as an educator. Become CK-12 Certified.
 WebinarsLive and archived sessions to learn about CK-12