Scientists use probes to identify the properties of objects, even if they cannot see the objects! In this activity, you will use a height probe to identify and analyze the height differences in an object that you cannot see.
Materials:
One set of materials per group of 2–3 students:
Observation box
Height probe: straightened paperclip at least 6 inches long
3 pieces of scan paper (provided) or graph paper
Thumbtack
Ruler
Pen
Glue-stick
Scissors
For the class:
Glue gun
Procedure:
Measuring With the Height Probe
1. How will you measure the height of the object inside the box using a ruler and height probe with different colored marks?
2. Measure the height of the box. Systematically measure the distance from the probe hole to the object for each probe hole. Subtract this distance from the height of the box and record your data on the scan area below or on a larger scan paper. These measurements represent the various heights of the object inside the box.
A
B
C
D
E
F
G
H
I
J
K
L
M
N
1
2
3
4
5
6
7
8
9
Slide 4
Making a Three-Dimensional Representation of the Objects in Your Box
1. Open a new spreadsheet in Excel.
2. Select the cells with data. Go to the chart wizard (chart symbol on the toolbar). Choose a surface plot: 2-D or 3-D (try both). Select NEXT at each dialogue box (Don’t worry about labels).
Notes:
Once you get the chart, you can change the scale of the coloring by double clicking on the legend, going to the scale tab and changing the value for the major unit.
You can rotate a 3-D chart by clicking on the chart and then dragging the corner dots.
Analyzing Your Data
1. Look at the 3-D representation you have created. Describe your object based upon your 3-D representation. Do you see any pattern in the numbers that gives a clue to the structure of the object inside the box? What does it look like?
2. Optional: Open your box and compare to the graph you just created.
3. Optional: Print and staple your graph to this journal page.
Activity: Modeling an AFM with a Refrigerator Magnet
Procedure:
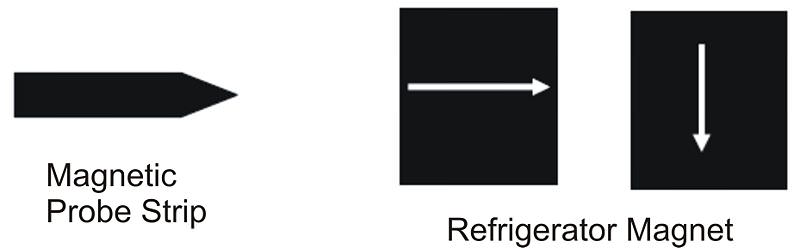
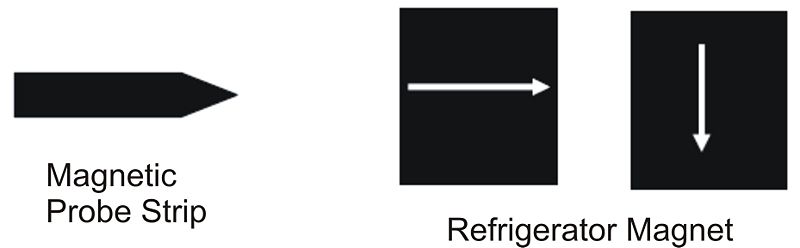
Use a refrigerator magnet to simulate and AFM probing a surface. The magnetic probe strip represents the scanning probe tip of an AFM. The refrigerator magnet represents a nanoparticle sample.
1. Drag the probe strip across the surface of the magnet, and notice any deflections. You will need to hold the probe strip nearly horizontal to the surface. Probe the magnet on various sides and in various directions.
2. As you know, the north pole of a magnet will attract the south pole of another magnet, and two magnets with either their north poles or their south poles pointed at each other will repel.
3. With this in mind, draw a representation of the magnetic poles in the box below.
Be sure to include the number of up and down deflections that you observe as you
probe your “nanoparticle.”
What is the distance between the up and down deflections?
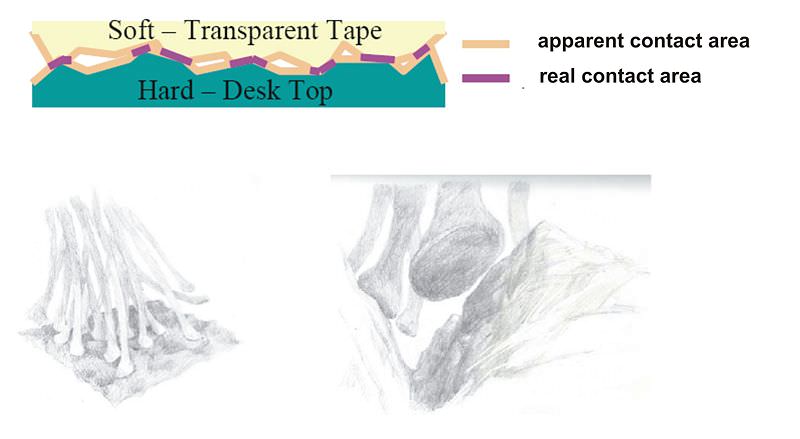
1. Describe using words how the spatula-shaped tips come into contact with a surface. How does the number of model spatulas on a gecko seta affect the amount of surface contact?
2. Look back at your previous methods (see Student Journal page 5–4, 5–5) as to how the gecko adheres to a wall. Are there some methods that you could eliminate because of the new information you now have? What evidence do you now have that supports the remaining possible adhesive methods?


 FlexiA FREE Digital Tutor for Every Student
 FlexBooks 2.0Customizable, digital textbooks in a new, interactive platform
 FlexBooksCustomizable, digital textbooks
 SchoolsFlexBooks from schools and districts near you
 Study GuidesQuick review with key information for each concept
 Adaptive PracticeBuilding knowledge at each student’s skill level
 SimulationsInteractive Physics & Chemistry Simulations
 PLIXPlay. Learn. Interact. eXplore.
 CCSS MathConcepts and FlexBooks aligned to Common Core
 NGSSConcepts aligned to Next Generation Science Standards
 Certified EducatorStand out as an educator. Become CK-12 Certified.
 WebinarsLive and archived sessions to learn about CK-12