Wind farms will devastate the countryside pointlessly.
James Lovelock
How much wind power could we plausibly generate?
We can make an estimate of the potential of on-shore (land-based) wind in the United Kingdom by multiplying the average power per unit land-area of a wind farm by the area per person in the UK:
power per person=wind power per unit area×area per person.
Chapter Wind II explains how to estimate the power per unit area of a wind farm in the UK. If the typical wind speed is 6 m/s (13 miles per hour, or 22 km/h), the power per unit area of wind farm is about 2W/m2.
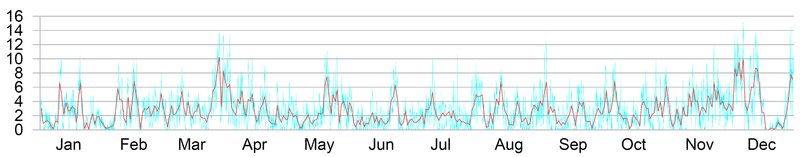
Figure 4.1: Cambridge mean wind speed in metres per second, daily (red line), and half-hourly (blue line) during 2006. See also figure.
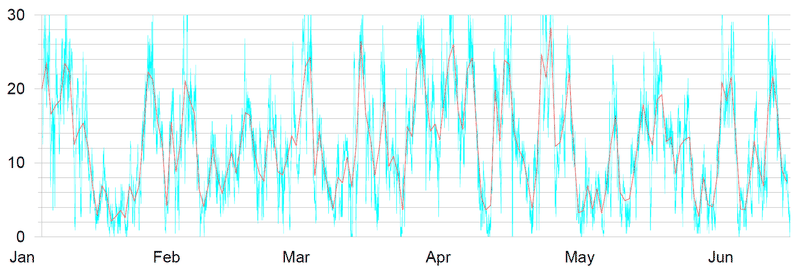
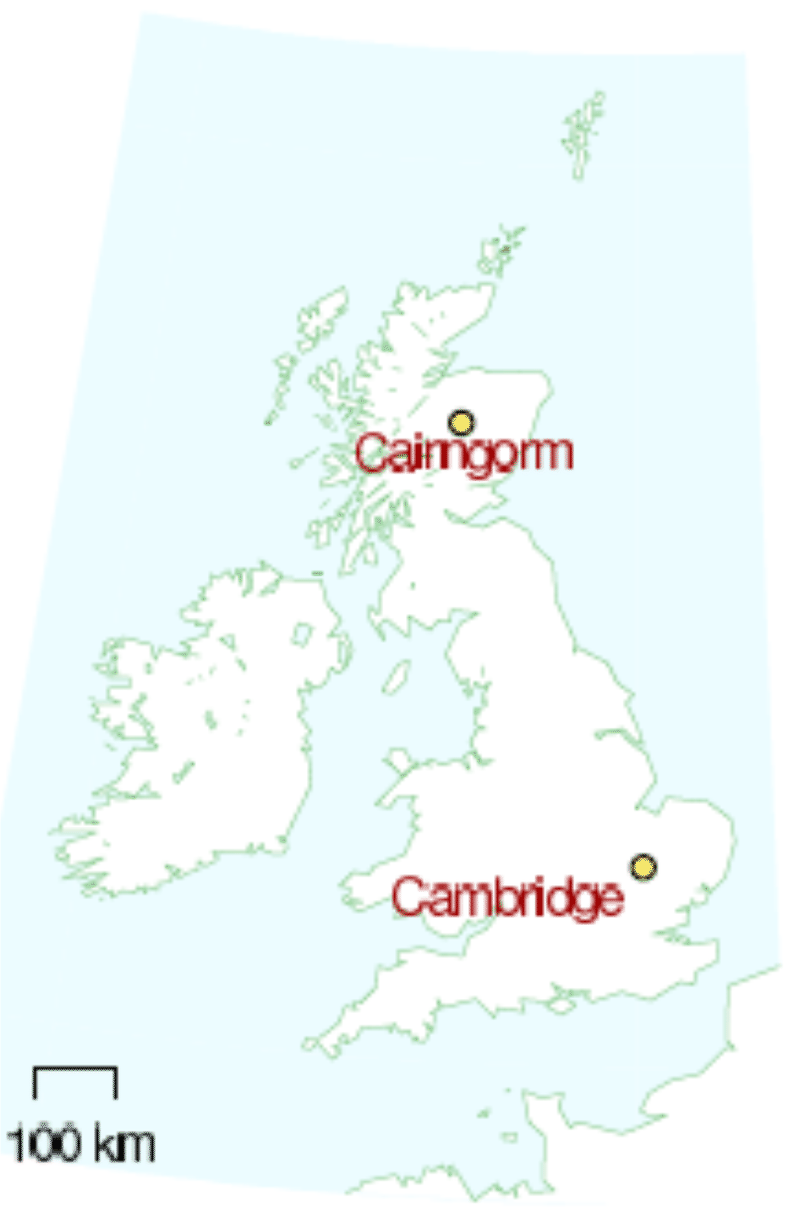
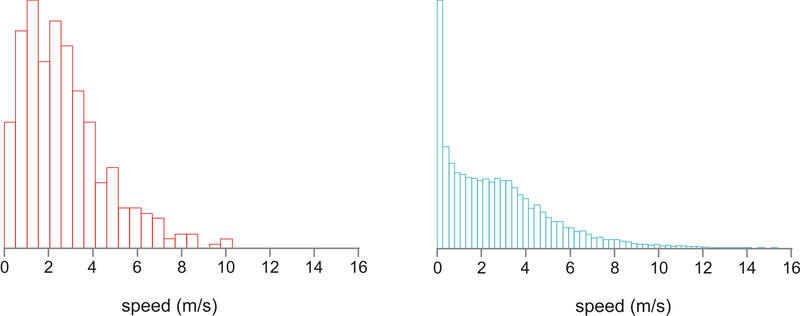
This figure of 6 m/s is probably an over-estimate for many locations in Britain. For example, figure shows daily average wind speeds in Cambridge during 2006. The daily average speed reached 6 m/s on only about 30 days of the year – see figure for a histogram. But some spots do have wind speeds above 6 m/s – for example, the summit of Cairngorm in Scotland (figure).
Figure 4.2: Cairngorm mean wind speed in metres per second, during six months of 2006.
Plugging in the British population density: 250 people per square kilometre, or 4000 square metres per person, we find that wind power could generate
2W/m2×4000m2/person=8000Wper person,
if wind turbines were packed across the whole country, and assuming 2W/m2 is the correct power per unit area. Converting to our favourite power units, that’s 200 kWh/d per person.
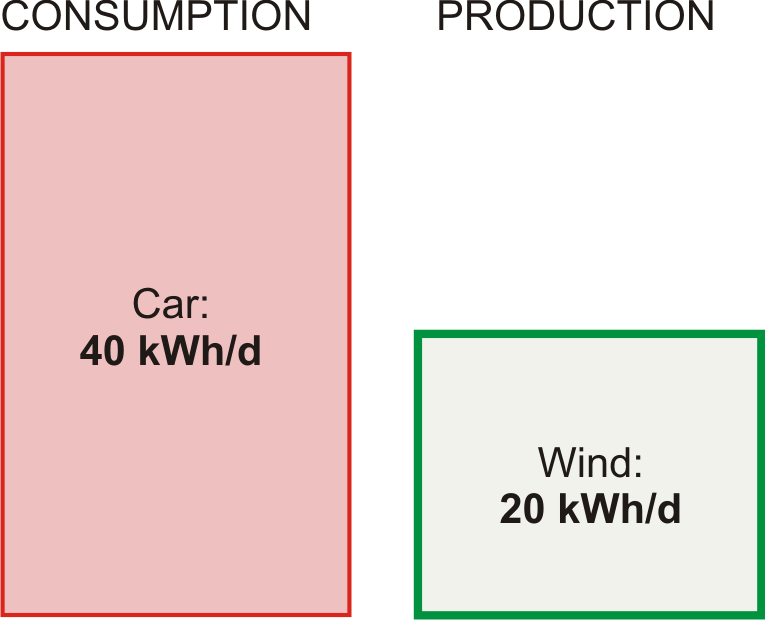
Let’s be realistic. What fraction of the country can we really imagine covering with windmills? Maybe 10%? Then we conclude: if we covered the windiest 10% of the country with windmills (delivering 2W/m2), we would be able to generate 20 kWh/d per person, which is half of the power used by driving an average fossil-fuel car 50 km per day.
Britain’s onshore wind energy resource may be “huge,” but it’s evidently not as huge as our huge consumption. We’ll come to offshore wind later.
Figure 4.3: Chapter Wind’s conclusion: the maximum plausible production from on-shore windmills in the United Kingdom is 20 kWh per day per person.
I should emphasize how generous an assumption I’m making. Let’s compare this estimate of British wind potential with current installed wind power worldwide. The windmills that would be required to provide the UK with 20 kWh/d per person amount to 50 times the entire wind hardware of Denmark; 7 times all the wind farms of Germany; and double the entire fleet of all wind turbines in the world.
Power per unit area
wind farm (speed 6m/s)
2W/m2
Facts worth remembering: wind farms.
Please don’t misunderstand me. Am I saying that we shouldn’t bother building wind farms? Not at all. I’m simply trying to convey a helpful fact, namely that if we want wind power to truly make a difference, the wind farms must cover a very large area.
This conclusion – that the maximum contribution of onshore wind, albeit “huge,” is much less than our consumption – is important, so let’s check the key figure, the assumed power per unit area of wind farm (2W/m2), against a real UK wind farm.
Population density of Britain
250 per km2↔4000m2 per person
Facts worth remembering: population density. See for more population densities.
The Whitelee wind farm being built near Glasgow in Scotland has 140 turbines with a combined peak capacity of 322 MW in an area of 55km2. That’s 6W/m2, peak. The average power produced is smaller because the turbines don’t run at peak output all the time. The ratio of the average power to the peak power is called the “load factor” or “capacity factor,” and it varies from site to site, and with the choice of hardware plopped on the site; a typical factor for a good site with modern turbines is 30%. If we assume Whitelee has a load factor of 33% then the average power production per unit land area is 2W/m2 – exactly the same as the power density we assumed above.
Figure 4.6: Histogram of Cambridge average wind speed in metres per second: daily averages (left), and half-hourly averages (right).
Queries
Wind turbines are getting bigger all the time. Do bigger wind turbines change this chapter’s answer?
Chapter Wind II explains. Bigger wind turbines deliver financial economies of scale, but they don’t greatly increase the total power per unit land area, because bigger windmills have to be spaced further apart. A wind farm that’s twice as tall will deliver roughly 30% more power.
Wind power fluctuates all the time. Surely that makes wind less useful?
Maybe. We’ll come back to this issue in Chapter Fluctuations and storage, where we’ll look at wind’s intermittency and discuss several possible solutions to this problem, including energy storage and demand management.
Notes and further reading
Figure 4.1 and figure 4.6. Cambridge wind data are from the Digital Technology Group, Computer Laboratory, Cambridge [vxhhj]. The weather station is on the roof of the Gates building, roughly 10m high. Wind speeds at a height of 50m are usually about 25% bigger. Cairngorm data (figure 4.2) are from Heriot–Watt University Physics Department [tdvml].
The windmills required to provide the UK with 20 kWh/d per person are 50 times the entire wind power of Denmark. Assuming a load factor of 33%, an average power of 20 kWh/d per person requires an installed capacity of 150 GW. At the end of 2006, Denmark had an installed capacity of 3.1 GW; Germany had 20.6 GW. The world total was 74 GW (wwindea.org). Incidentally, the load factor of the Danish wind fleet was 22% in 2006, and the average power it delivered was 3 kWh/d per person.
NOTES / HIGHLIGHTS
Please Sign In to create your own Highlights / Notes
Notes/Highlights
Color
Highlighted Text
Notes
Please Sign In to create your own Highlights / Notes
Currently there are no resources to be displayed.
Description
This book explores six strategies for eliminating the gap between consumption and renewable production.


 FlexiA FREE Digital Tutor for Every Student
 FlexBooks 2.0Customizable, digital textbooks in a new, interactive platform
 FlexBooksCustomizable, digital textbooks
 SchoolsFlexBooks from schools and districts near you
 Study GuidesQuick review with key information for each concept
 Adaptive PracticeBuilding knowledge at each student’s skill level
 SimulationsInteractive Physics & Chemistry Simulations
 PLIXPlay. Learn. Interact. eXplore.
 CCSS MathConcepts and FlexBooks aligned to Common Core
 NGSSConcepts aligned to Next Generation Science Standards
 Certified EducatorStand out as an educator. Become CK-12 Certified.
 WebinarsLive and archived sessions to learn about CK-12