We are estimating how our consumption stacks up against conceivable sustainable production. In the last three chapters we found car-driving and plane-flying to be bigger than the plausible on-shore wind-power potential of the United Kingdom. Could solar power put production back in the lead?
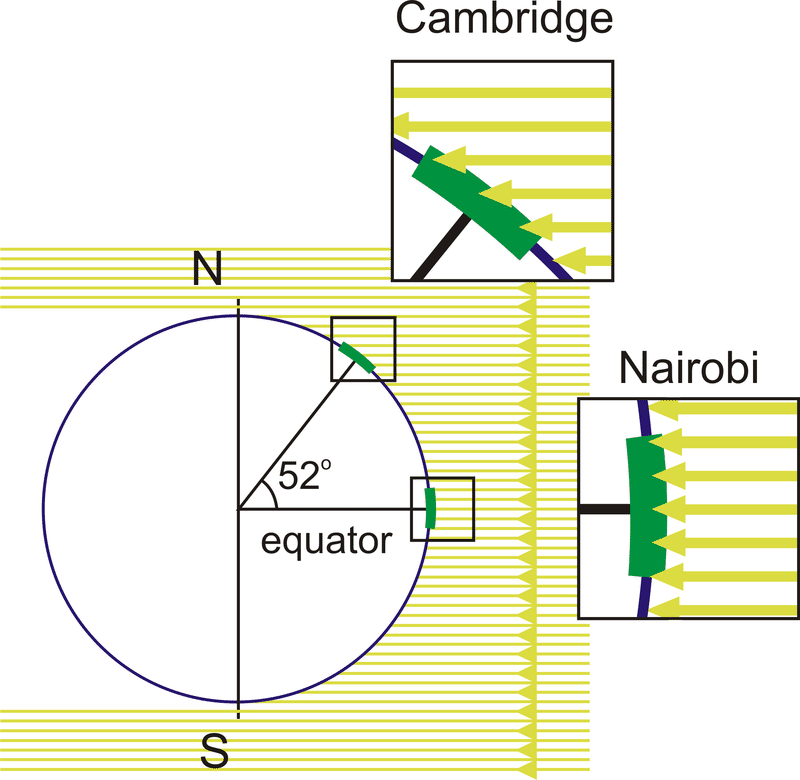
Figure 6.1: Sunlight hitting the earth at midday on a spring or autumn day. The density of sunlight per unit land area in Cambridge (latitude 52∘) is about 60% of that at the equator.
The power of raw sunshine at midday on a cloudless day is 1000W per square metre. That’s 1000Wperm2 of area oriented towards the sun, not per m2 of land area. To get the power per m2 of land area in Britain, we must make several corrections. We need to compensate for the tilt between the sun and the land, which reduces the intensity of midday sun to about 60% of its value at the equator (figure 6.1). We also lose out because it is not midday all the time. On a cloud-free day in March or September, the ratio of the average intensity to the midday intensity is about 32%. Finally, we lose power because of cloud cover. In a typical UK location the sun shines during just 34% of daylight hours.
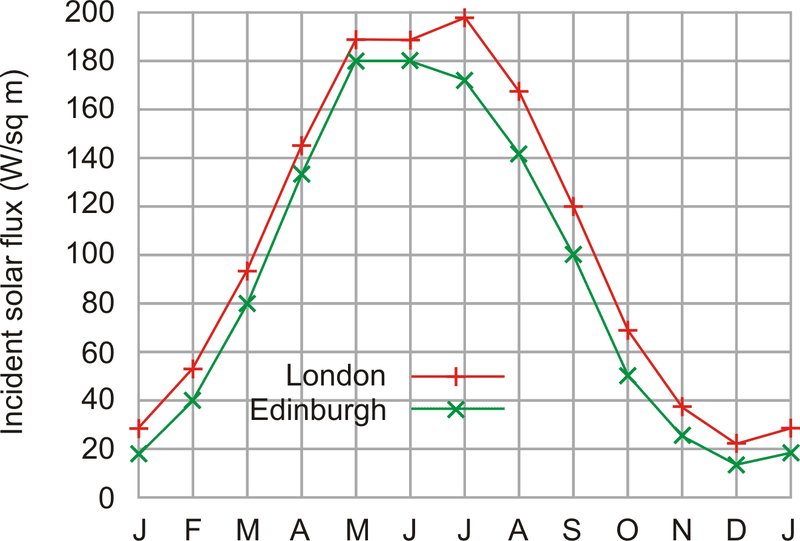
Figure 6.2: Average solar intensity in London and Edinburgh as a function of time of year. The average intensity, per unit land area, is 100W/m2.
The combined effect of these three factors and the additional complication of the wobble of the seasons is that the average raw power of sunshine per square metre of south-facing roof in Britain is roughly 110W/m2, and the average raw power of sunshine per square metre of flat ground is roughly 100W/m2.
We can turn this raw power into useful power in four ways:
Solar thermal: using the sunshine for direct heating of buildings or water.
Solar photovoltaic: generating electricity.
Solar biomass: using trees, bacteria, algae, corn, soy beans, or oilseed to make energy fuels, chemicals, or building materials.
Food: the same as solar biomass, except we shovel the plants into humans or other animals.
(In a later chapter we’ll also visit a couple of other solar power techniques appropriate for use in deserts.)
Let’s make quick rough estimates of the maximum plausible powers that each of these routes could deliver. We’ll neglect their economic costs, and the energy costs of manufacturing and maintaining the power facilities.
Solar thermal
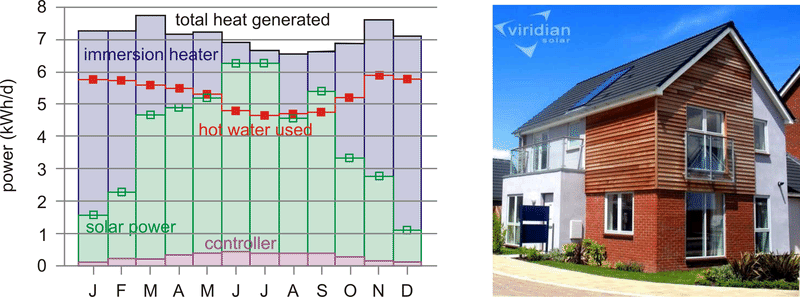
The simplest solar power technology is a panel making hot water. Let’s imagine we cover all south-facing roofs with solar thermal panels – that would be about 10m2 of panels per person – and let’s assume these are 50%-efficient at turning the sunlight’s 110W/m2 into hot water (figure 6.3).
Multiplying
50%×10m2×110W/m2
we find solar heating could deliver
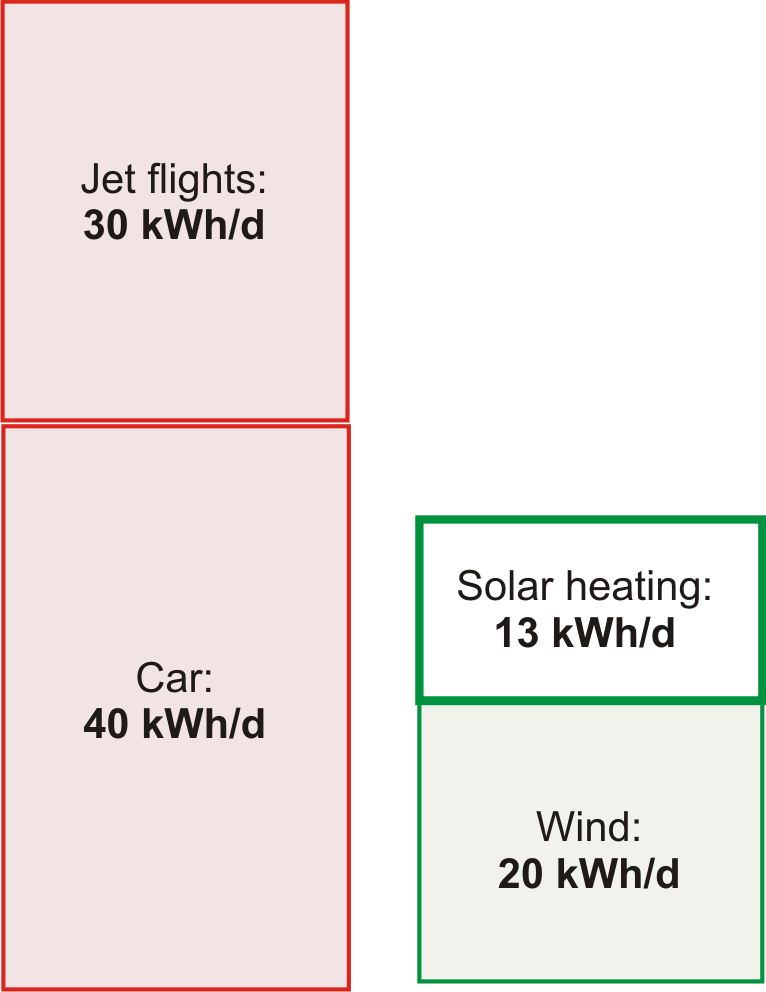
13kWhper day per person.
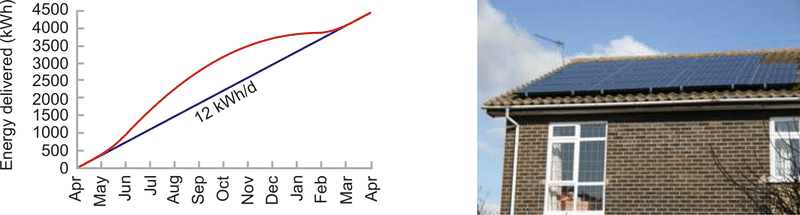
Figure 6.3: Solar power generated by a 3m2 hot-water panel (green), and supplementary heat required (blue) to make hot water in the test house of Viridian Solar. (The photograph shows a house with the same model of panel on its roof.) The average solar power from 3m2 was 3.8 kWh/d. The experiment simulated the hot-water consumption of an average European household – 100 litres of hot (60∘C) water per day. The 1.5–2 kWh/d gap between the total heat generated (black line, top) and the hot water used (red line) is caused by heat-loss. The magenta line shows the electrical power required to run the solar system. The average power per unit area of these solar panels is 53W/m2.
I colour this production box white in figure 6.4 to indicate that it describes production of low-grade energy – hot water is not as valuable as the highgrade electrical energy that wind turbines produce. Heat can’t be exported to the electricity grid. If you don’t need it, then it’s wasted. We should bear in mind that much of this captured heat would not be in the right place. In cities, where many people live, residential accommodation has less roof area per person than the national average. Furthermore, this power would be delivered non-uniformly through the year.
Figure 6.4: Solar thermal: a 10m2 array of thermal panels can deliver (on average) about 13 kWh per day of thermal energy.
Solar photovoltaic
Photovoltaic (PV) panels convert sunlight into electricity. Typical solar panels have an efficiency of about 10%; expensive ones perform at 20%. (Fundamental physical laws limit the efficiency of photovoltaic systems to at best 60% with perfect concentrating mirrors or lenses, and 45% without concentration. A mass-produced device with efficiency greater than 30% would be quite remarkable.) The average power delivered by south-facing 20%-efficient photovoltaic panels in Britain would be
20%×110W/m2=22W/m2.
Figure 6.5 shows data to back up this number. Let’s give every person 10m2 of expensive (20%-efficient) solar panels and cover all south-facing roofs. These will deliver
5kWhper day per person.
Figure 6.5: Solar photovoltaics: data from a 25−m2 array in Cambridgeshire in 2006. The peak power delivered by this array is about 4 kW. The average, year-round, is 12 kWh per day. That’s 20W per square metre of panel.
Since the area of all south-facing roofs is 10m2 per person, there certainly isn’t space on our roofs for these photovoltaic panels as well as the solar thermal panels of the last section. So we have to choose whether to have the photovoltaic contribution or the solar hot water contribution. But I’ll just plop both these on the production stack anyway. Incidentally, the present cost of installing such photovoltaic panels is about four times the cost of installing solar thermal panels, but they deliver only half as much energy, albeit high-grade energy (electricity). So I’d advise a family thinking of going solar to investigate the solar thermal option first. The smartest solution, at least in sunny countries, is to make combined systems that deliver both electricity and hot water from a single installation. This is the approach pioneered by Heliodynamics, who reduce the overall cost of their systems by surrounding small high-grade gallium arsenide photovoltaic units with arrays of slowly-moving flat mirrors; the mirrors focus the sun-light onto the photovoltaic units, which deliver both electricity and hot water; the hot water is generated by pumping water past the back of the photovoltaic units.
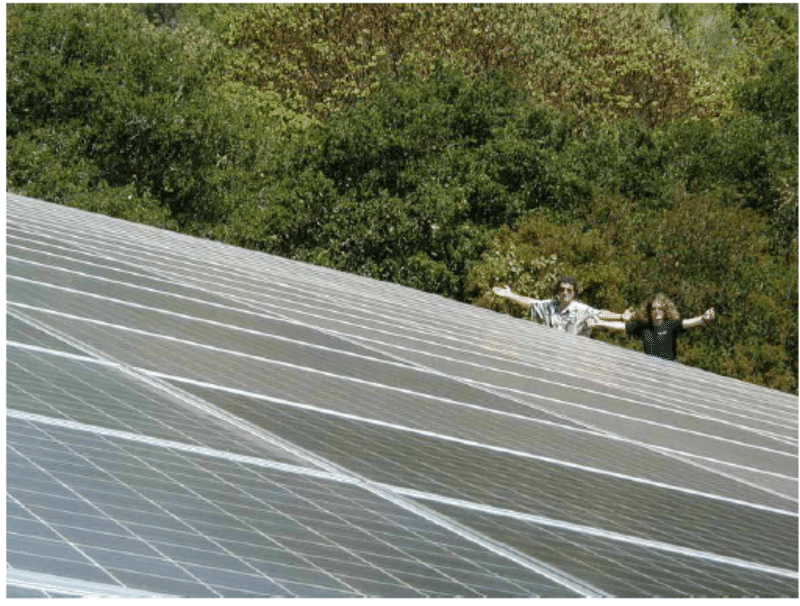
Figure 6.6: Two solar warriors enjoying their photovoltaic system, which powers their electric cars and home. The array of 120 panels (300W each, 2.2m2 each) has an area of 268m2, a peak output (allowing for losses in DC–to–AC conversion) of 30.5 kW, and an average output – in California, near Santa Cruz – of 5 kW (19W/m2). Photo kindly provided by Kenneth Adelman. www.solarwarrior.com
The conclusion so far: covering your south-facing roof at home with photovoltaics may provide enough juice to cover quite a big chunk of your personal average electricity consumption; but roofs are not big enough to make a huge dent in our total energy consumption. To do more with PV, we need to step down to terra firma. The solar warriors in figure 6.6 show the way.
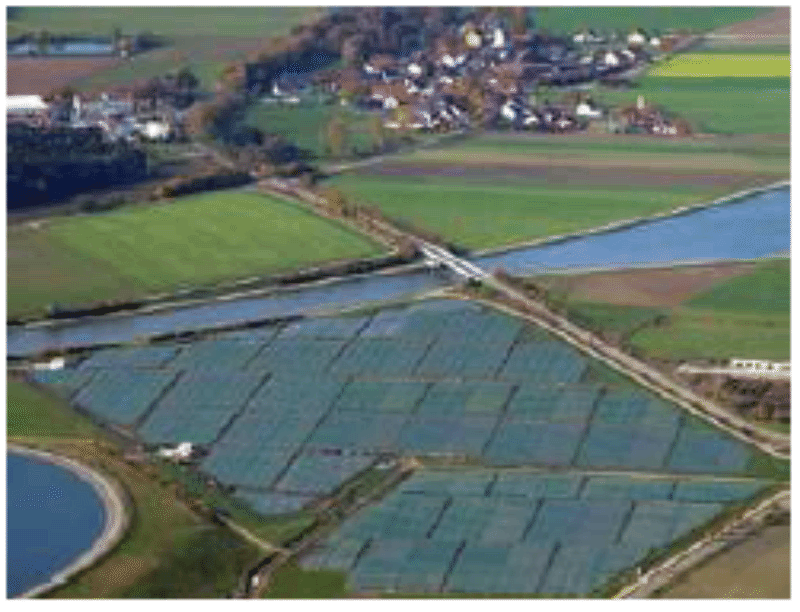
Figure 6.7: A solar photovoltaic farm: the 6.3 MW (peak) Solarpark in Mühlhausen, Bavaria. Its average power per unit land area is expected to be about 5W/m2. Photo by SunPower.
Fantasy time: solar farming
If a breakthrough of solar technology occurs and the cost of photovoltaics came down enough that we could deploy panels all over the countryside, what is the maximum conceivable production? Well, if we covered 5% of the UK with 10%-efficient panels, we’d have
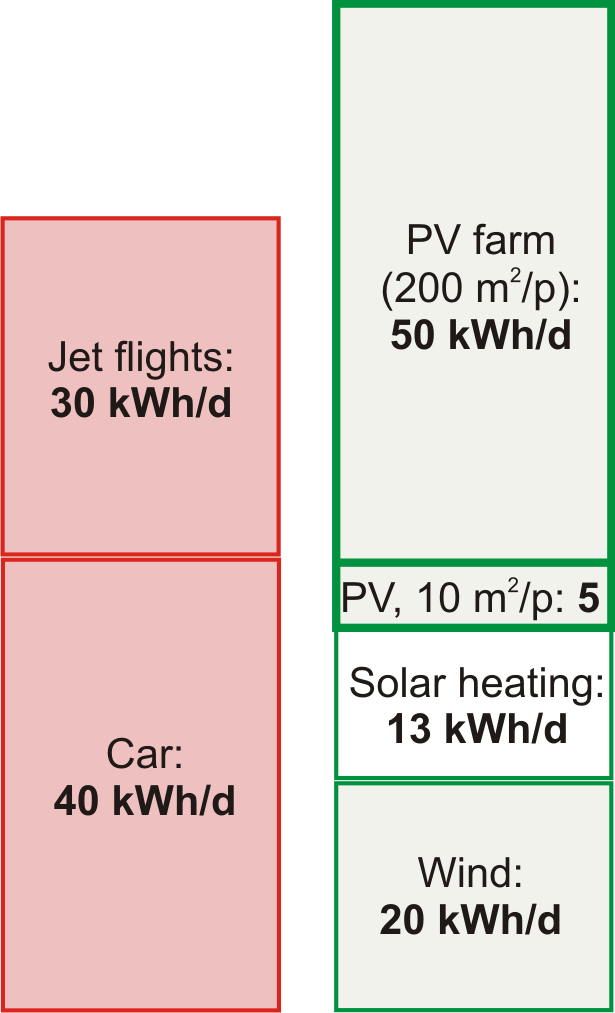
10%×100W/m2×200m2per person≃50kWh/day/person.
I assumed only 10%-efficient panels, by the way, because I imagine that solar panels would be mass-produced on such a scale only if they were very cheap, and it’s the lower-efficiency panels that will get cheap first. The power density (the power per unit area) of such a solar farm would be
10%×100W/m2=10W/m2.
This power density is twice that of the Bavaria Solarpark (figure 6.7).
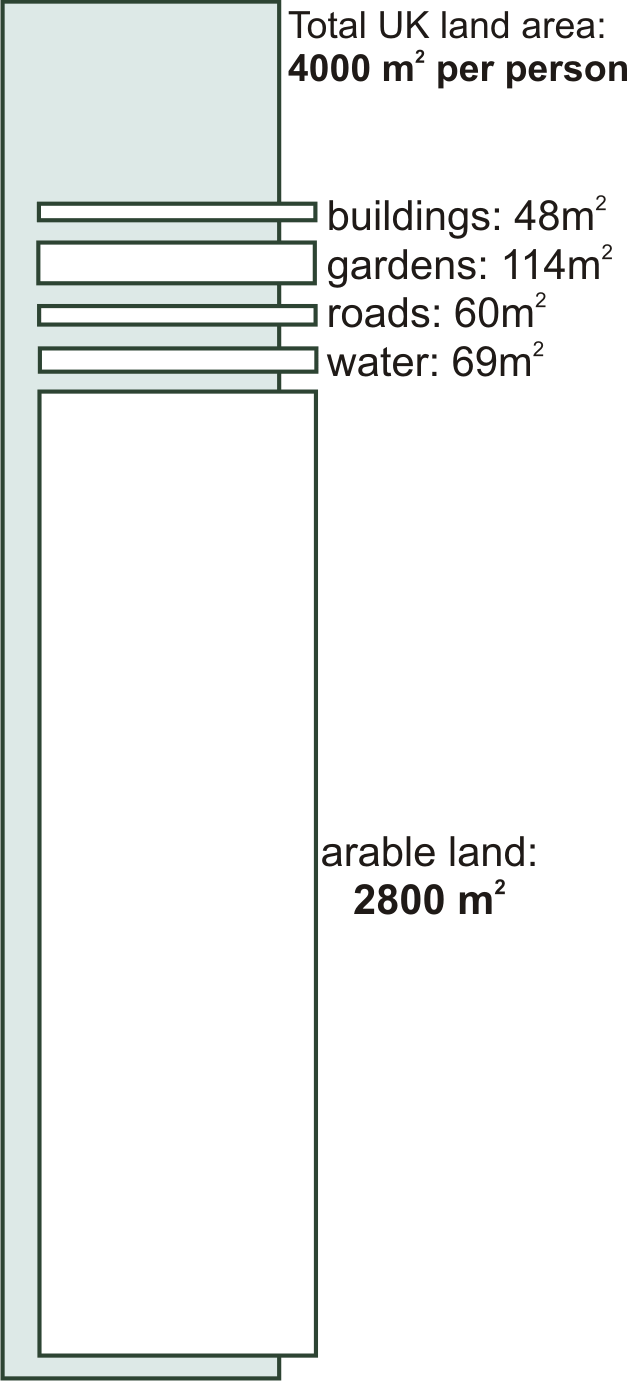
Figure 6.8: Land areas per person in Britain.
Could this flood of solar panels co-exist with the army of windmills we imagined in Chapter Wind? Yes, no problem: windmills cast little shadow, and ground-level solar panels have negligible effect on the wind. How audacious is this plan? The solar power capacity required to deliver this 50 kWh per day per person in the UK is more than 100 times all the photovoltaics in the whole world. So should I include the PV farm in my sustainable production stack? I’m in two minds. At the start of this book I said I wanted to explore what the laws of physics say about the limits of sustainable energy, assuming money is no object. On those grounds, I should certainly go ahead, industrialize the countryside, and push the PV farm onto the stack. At the same time, I want to help people figure out what we should be doing between now and 2050. And today, electricity from solar farms would be four times as expensive as the market rate. So I feel a bit irresponsible as I include this estimate in the sustainable production stack in figure 6.9 – paving 5% of the UK with solar panels seems beyond the bounds of plausibility in so many ways. If we seriously contemplated doing such a thing, it would quite probably be better to put the panels in a two-fold sunnier country and send some of the energy home by power lines. We’ll return to this idea in Chapter Living on other countries' renewables?.
Mythconceptions
Manufacturing a solar panel consumes more energy than it will ever deliver.
False. The energy yield ratio (the ratio of energy delivered by a system over its lifetime, to the energy required to make it) of a roof-mounted, grid-connected solar system in Central Northern Europe is 4, for a system with a lifetime of 20 years (Richards and Watt, 2007); and more than 7 in a sunnier spot such as Australia. (An energy yield ratio bigger than one means that a system is A Good Thing, energy-wise.) Wind turbines with a lifetime of 20 years have an energy yield ratio of 80.
Aren’t photovoltaic panels going to get more and more efficient as technology improves?
I am sure that photovoltaic panels will become ever cheaper; I’m also sure that solar panels will become ever less energy-intensive to manufacture, so their energy yield ratio will improve. But this chapter’s photo-voltaic estimates weren’t constrained by the economic cost of the panels, nor by the energy cost of their manufacture. This chapter was concerned with the maximum conceivable power delivered. Photovoltaic panels with 20% efficiency are already close to the theoretical limit (see this chapter’s endnotes). I’ll be surprised if this chapter’s estimate for roof-based photo-voltaics ever needs a significant upward revision.
Figure 6.9: Solar photovoltaics: a 10m2 array of building-mounted south-facing panels with 20% efficiency can deliver about 5 kWh per day of electrical energy. If 5% of the country were coated with 10%-efficient solar panels (200m2 of panels per person) they would deliver 50 kWh/day/person.
Solar biomass
All of a sudden, you know, we may be in the energy business by being able to grow grass on the ranch! And have it harvested and converted into energy. That’s what’s close to happening.
George W. Bush, February 2006
All available bioenergy solutions involve first growing green stuff, and then doing something with the green stuff. How big could the energy collected by the green stuff possibly be? There are four main routes to get energy from solar-powered biological systems:
We can grow specially-chosen plants and burn them in a power station that produces electricity or heat or both. We’ll call this “coal substitution.”
We can grow specially-chosen plants (oil-seed rape, sugar cane, or corn, say), turn them into ethanol or biodiesel, and shove that into cars, trains, planes or other places where such chemicals are useful. Or we might cultivate genetically-engineered bacteria, cyanobacteria, or algae that directly produce hydrogen, ethanol, or butanol, or even electricity. We’ll call all such approaches “petroleum substitution.”
We can take by-products from other agricultural activities and burn them in a power station. The by-products might range from straw (a by-product of Weetabix) to chicken poo (a by-product of McNuggets). Burning by-products is coal substitution again, but using ordinary plants, not the best high-energy plants. A power station that burns agricultural by-products won’t deliver as much power per unit area of farmland as an optimized biomass-growing facility, but it has the advantage that it doesn’t monopolize the land. Burning methane gas from landfill sites is a similar way of getting energy, but it’s sustainable only as long as we have a sustainable source of junk to keep putting into the landfill sites. (Most of the landfill methane comes from wasted food; people in Britain throw away about 300 g of food per day per person.) Incinerating household waste is another slightly less roundabout way of getting power from solar biomass.
We can grow plants and feed them directly to energy-requiring humans or other animals.
Figure 6.10: Some Miscanthus grass enjoying the company of Dr Emily Heaton, who is 5’4” (163 cm) tall. In Britain, Miscanthus achieves a power per unit area of 0.75W/m2. Photo provided by the University of Illinois.
For all of these processes, the first staging post for the energy is in a chemical molecule such as a carbohydrate in a green plant. We can therefore estimate the power obtainable from any and all of these processes by estimating how much power could pass through that first staging post. All subsequent steps involving tractors, animals, chemical facilities, landfill sites, or power stations can only lose energy. So the power at the first staging post is an upper bound on the power available from all plant-based power solutions.
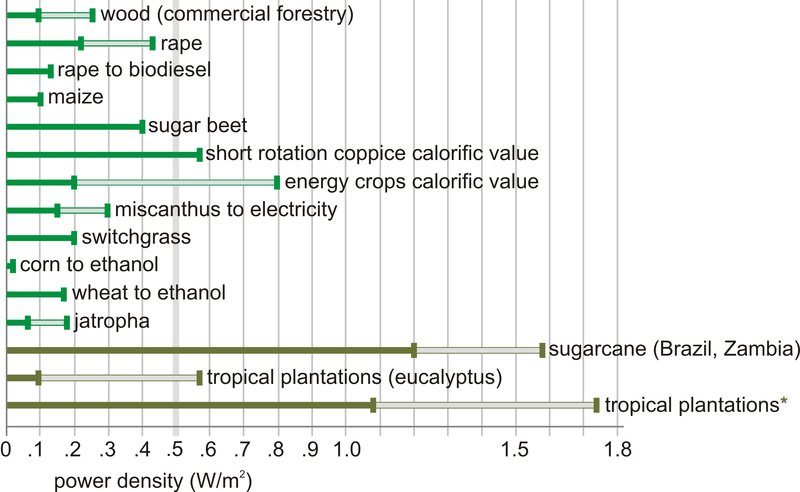
So, let’s simply estimate the power at the first staging post. (In Chapter Solar II we’ll go into more detail, estimating the maximum contribution of each process.) The average harvestable power of sunlight in Britain is 100W/m2. The most efficient plants in Europe are about 2%-efficient at turning solar energy into carbohydrates, which would suggest that plants might deliver 2W/m2; however, their efficiency drops at higher light levels, and the best performance of any energy crops in Europe is closer to 0.5W/m2. Let’s cover 75% of the country with quality green stuff. That’s 3000m2 per person devoted to bio-energy. This is the same as the British land area currently devoted to agriculture. So the maximum power available, ignoring all the additional costs of growing, harvesting, and processing the greenery, is
0.5W/m2×3000m2per person=36kWh/dper person.
Figure 6.11: Power production, per unit area, achieved by various plants. For sources, see the end-notes. These power densities vary depending on irrigation and fertilization; ranges are indicated for some crops, for example wood has a range from 0.095–0.254W/m2. The bottom three power densities are for crops grown in tropical locations. The last power density (tropical plantations∗) assumes genetic modification, fertilizer application, and irrigation. In the text, I use 0.5W/m2 as a summary figure for the best energy crops in NW Europe.
Wow. That’s not very much, considering the outrageously generous assumptions we just made, to try to get a big number. If you wanted to get biofuels for cars or planes from the greenery, all the other steps in the chain from farm to spark plug would inevitably be inefficient. I think it’d be optimistic to hope that the overall losses along the processing chain would be as small as 33%. Even burning dried wood in a good wood boiler loses 20% of the heat up the chimney. So surely the true potential power from biomass and biofuels cannot be any bigger than 24 kWh/d per person. And don’t forget, we want to use some of the greenery to make food for us and for our animal companions.
Could genetic engineering produce plants that convert solar energy to chemicals more efficiently? It’s conceivable; but I haven’t found any scientific publication predicting that plants in Europe could achieve net power production beyond 1W/m2.
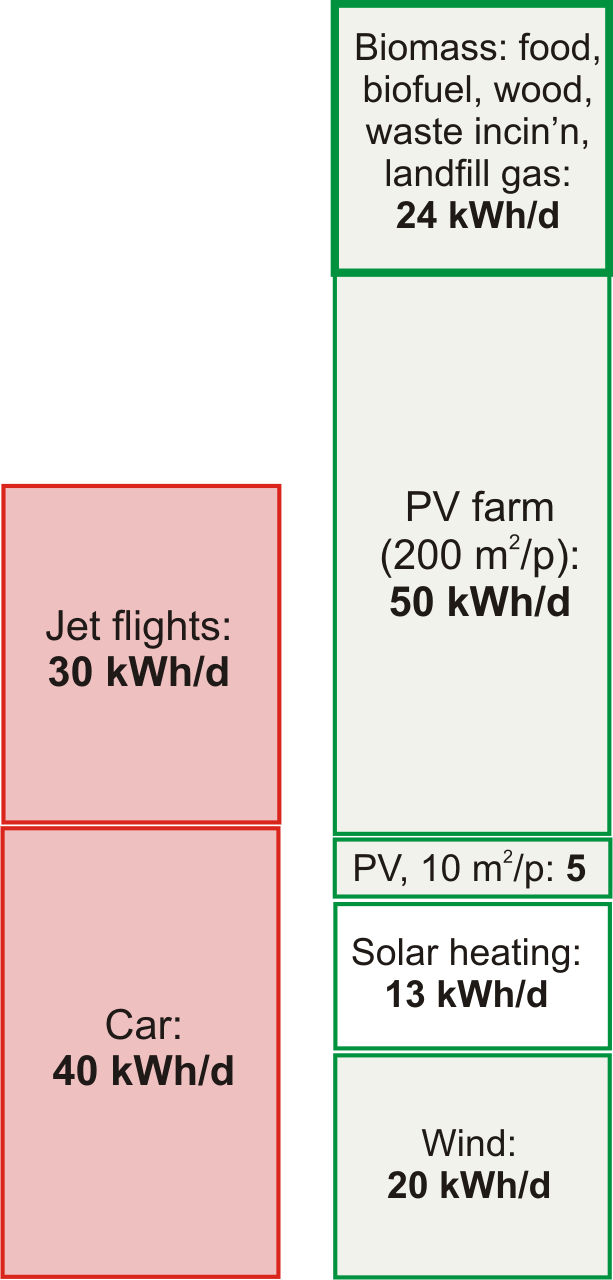
I’ll pop 24 kWh/d per person onto the green stack, emphasizing that I think this number is an over-estimate – I think the true maximum power that we could get from biomass will be smaller because of the losses in farming and processing.
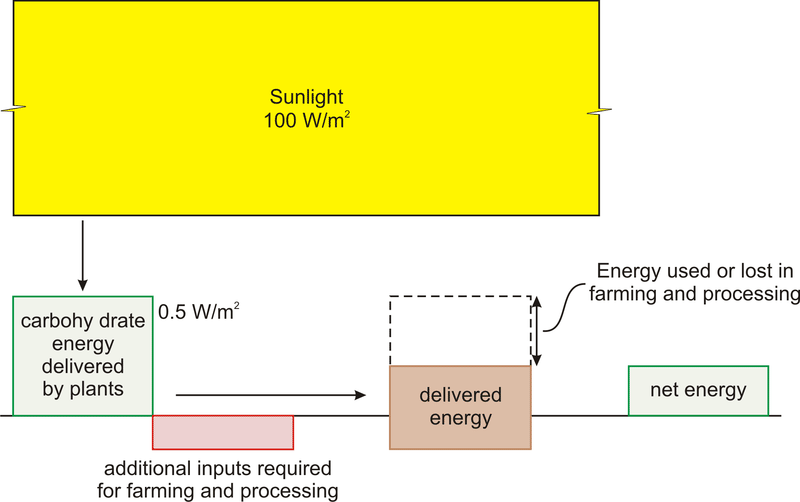
I think one conclusion is clear: biofuels can’t add up – at least, not in countries like Britain, and not as a replacement for all transport fuels. Even leaving aside biofuels’ main defects – that their production competes with food, and that the additional inputs required for farming and processing often cancel out most of the delivered energy (figure 6.14) – biofuels made from plants, in a European country like Britain, can deliver so little power, I think they are scarcely worth talking about.
Figure 6.12: Solar biomass, including all forms of biofuel, waste incineration, and food: 24 kWh/d per person.
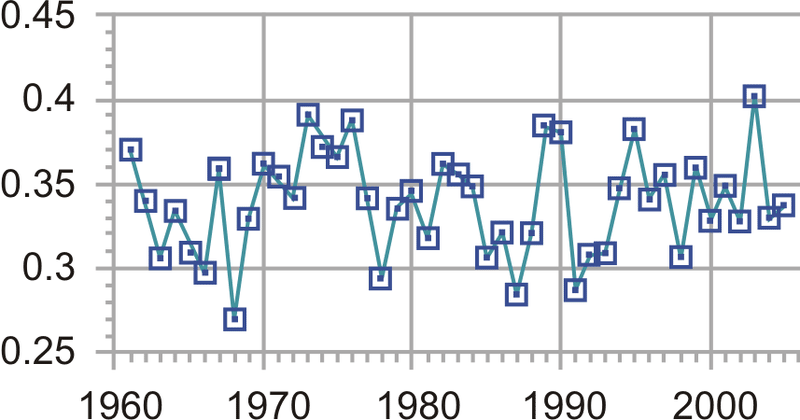
Figure 6.13: Sunniness of Cambridge: the number of hours of sunshine per year, expressed as a fraction of the total number of daylight hours.
Notes and further reading
...compensate for the tilt between the sun and the land. The latitude of Cambridge is θ=52∘; the intensity of midday sunlight is multiplied by cosθ≃0.6. The precise factor depends on the time of year, and varies between cos(θ+23∘)=0.26 and cos(θ−23∘)=0.87.
In a typical UK location the sun shines during one third of daylight hours. The Highlands get 1100 h sunshine per year – a sunniness of 25%. The best spots in Scotland get 1400 h per year – 32%. Cambridge: 1500±130 h per year – 34%. South coast of England (the sunniest part of the UK): 1700 h per year – 39%. [2rqloc] Cambridge data from [2szckw]. See also figure 6.16.
Figure 6.14: This figure illustrates the quantitative questions that must be asked of any proposed biofuel. What are the additional energy inputs required for farming and processing? What is the delivered energy? What is the net energy output? Often the additional inputs and losses wipe out most of the energy delivered by the plants.
The average raw power of sunshine per square metre of south-facing roof in Britain is roughly 110W/m2, and of flat ground, roughly 100W/m2. Source: NASA “Surface meteorology and Solar Energy” [5hrxls]. Surprised that there’s so little difference between a tilted roof facing south and a horizontal roof? I was. The difference really is just 10% [6z9epq].
...that would be about 10m2 of panels per person. I estimated the area of south-facing roof per person by taking the area of land covered by buildings per person (48m2 in England – table I.6), multiplying by 14 to get the south-facing fraction, and bumping the area up by 40% to allow for roof tilt. This gives 16m2 per person. Panels usually come in inconvenient rectangles so some fraction of roof will be left showing; hence 10m2 of panels.
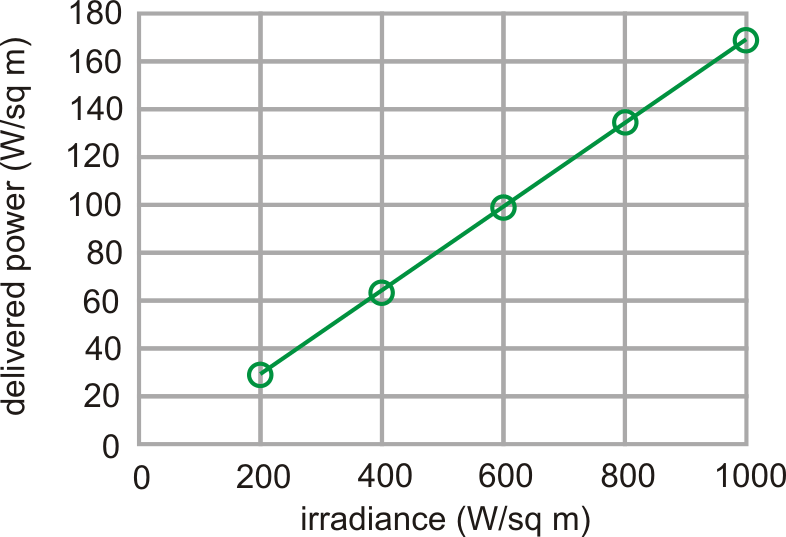
Figure 6.15: Power produced by the Sanyo HIP-210NKHE1 module as a function of light intensity (at 25∘C, assuming an output voltage of 40V). Source: datasheet, www.sanyo-solar.eu.
The average power delivered by photovoltaic panels...
There’s a myth going around that states that solar panels produce almost as much power in cloudy conditions as in sunshine. This is simply not true. On a bright but cloudy day, solar photovoltaic panels and plants do continue to convert some energy, but much less: photovoltaic production falls roughly ten-fold when the sun goes behind clouds (because the intensity of the in-coming sunlight falls ten-fold). As figure 6.15 shows, the power delivered by photovoltaic panels is almost exactly proportional to the intensity of the sunlight – at least, if the panels are at 25∘C. To complicate things, the power delivered depends on temperature too – hotter panels have reduced power (typically 0.38% loss in power per ∘C) – but if you check data from real panels, e.g. at www.solarwarrior.com, you can confirm the main point: output on a cloudy day is far less than on a sunny day. This issue is obfuscated by some solar-panel promoters who discuss how the “efficiency” varies with sunlight. “The panels are more efficient in cloudy conditions,” they say; this may be true, but efficiency should not be confused with delivered power.
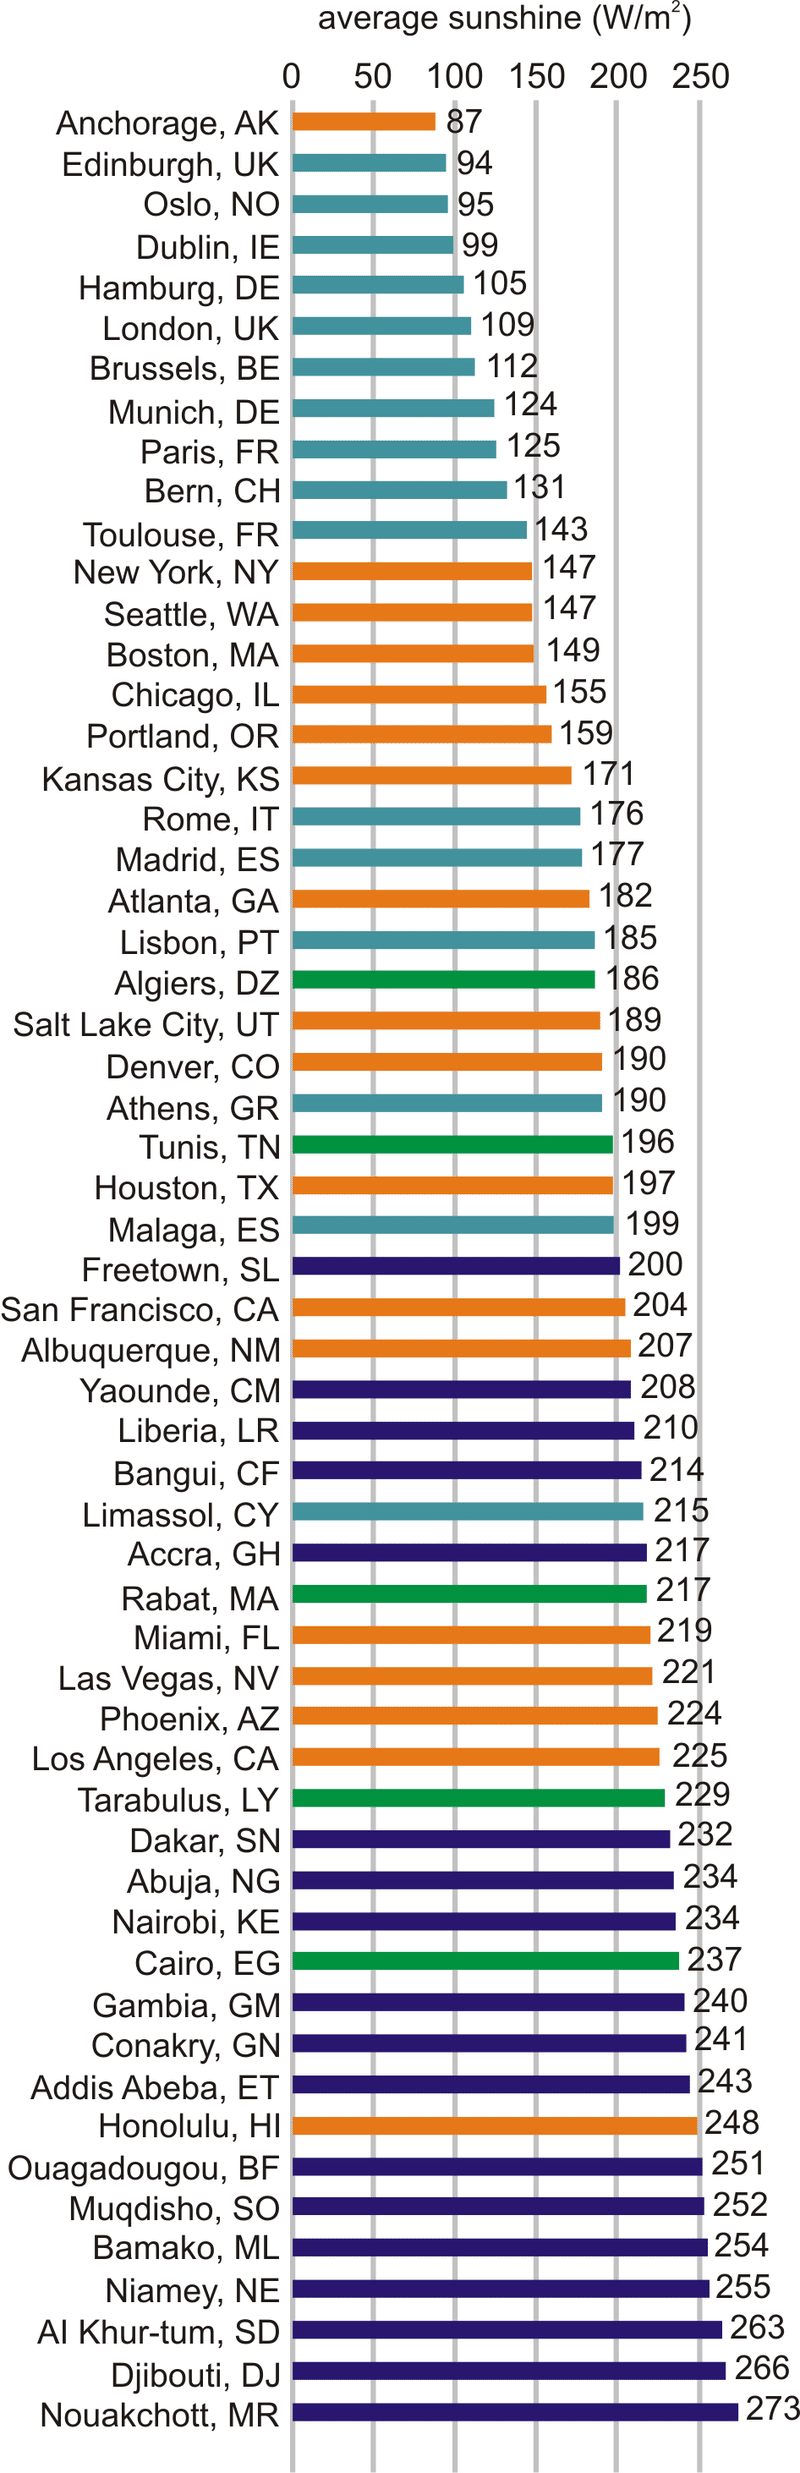
Figure 6.16: Average power of sunshine falling on a horizontal surface in selected locations in Europe, North America, and Africa.
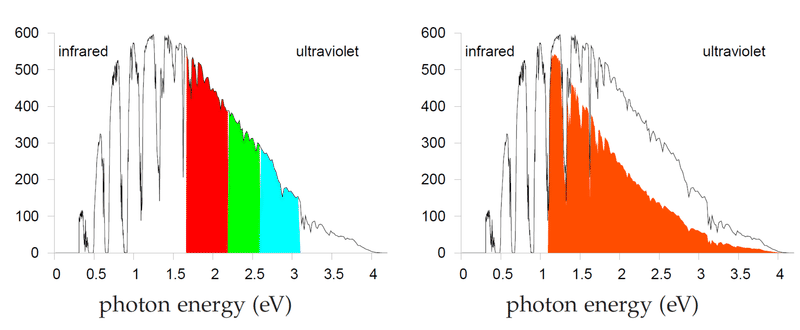
Figure 6.17: Part of Shockley and Queisser’s explanation for the 31% limit of the efficiency of simple photovoltaics. Left: the spectrum of midday sunlight. The vertical axis shows the power density in W/m2 per eV of spectral interval. The visible part of the spectrum is indicated by the coloured section. Right: the energy captured by a photovoltaic device with a single band-gap at 1.1 eV is shown by the tomato-shaded area. Photons with energy less than the band-gap are lost. Some of the energy of photons above the band-gap is lost; for example half of the energy of every 2.2 eV photon is lost. Further losses are incurred because of inevitable radiation from recombining charges in the photovoltaic material.
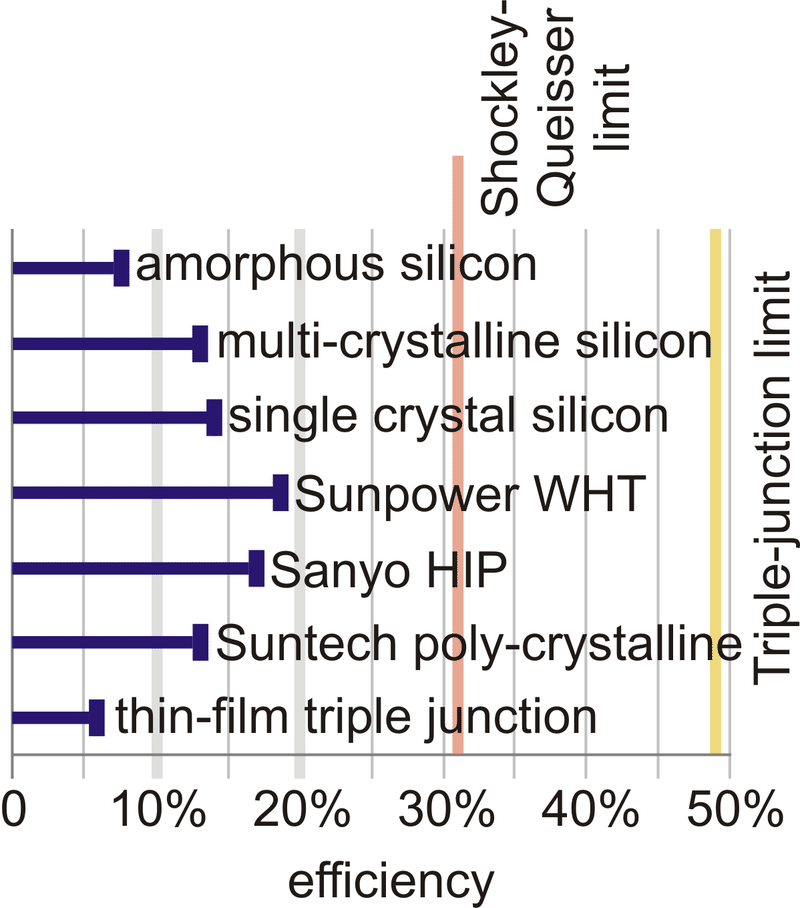
Typical solar panels have an efficiency of about 10%; expensive ones perform at 20%. See figure 6.18. Sources: Turkenburg (2000), Sunpower www.sunpowercorp.com, Sanyo www.sanyo-solar.eu, Suntech.
A device with efficiency greater than 30% would be quite remarkable. This is a quote from Hopfield and Gollub (1978), who were writing about panels without concentrating mirrors or lenses. The theoretical limit for a standard “single-junction” solar panel without concentrators, the Shockley–Queisser limit, says that at most 31% of the energy in sunlight can be converted to electricity (Shockley and Queisser, 1961). (The main reason for this limit is that a standard solar material has a property called its band-gap, which defines a particular energy of photon that that material converts most efficiently. Sunlight contains photons with many energies; photons with energy below the band-gap are not used at all; photons with energy greater than the band-gap may be captured, but all their energy in excess of the band-gap is lost.) Concentrators (lenses or mirrors) can both reduce the cost (per watt) of photovoltaic systems, and increase their efficiency. The Shockley–Queisser limit for solar panels with concentrators is 41% efficiency. The only way to beat the Shockley–Queisser limit is to make fancy photo-voltaic devices that split the light into different wavelengths, processing each wavelength-range with its own personalized band-gap. These are called multiple-junction photovoltaics. Recently multiple-junction photovoltaics with optical concentrators have been reported to be about 40% efficient. [2tl7t6], www.spectrolab.com. In July 2007, the University of Delaware reported 42.8% efficiency with 20-times concentration [6hobq2], [2lsx6t]. In August 2008, NREL reported 40.8% efficiency with 326-times concentration [62ccou]. Strangely, both these results were called world efficiency records. What multiple-junction devices are available on the market? Uni-solar sell a thin-film triple-junction 58W (peak) panel with an area of 1m2. That implies an efficiency, in full sunlight, of only 5.8%.
Figure 6.18: Efficiencies of solar photovoltaic modules available for sale today. In the text I assume that roof-top photovoltaics are 20% efficient, and that country-covering photovoltaics would be 10% efficient. In a location where the average power density of incoming sunlight is 100W/m2, 20%-efficient panels deliver 20W/m2.
Figure 6.5: Solar PV data. Data and photograph kindly provided by Jonathan Kimmitt.
Heliodynamics – www.hdsolar.com. See figure 6.19.
A similar system is made by Arontis www.arontis.se.
The Solarpark in Muhlhausen, Bavaria. On average this 25-hectare farm is expected to deliver 0.7 MW (17000 kWh per day).
New York’s Stillwell Avenue subway station has integrated amorphous silicon thin-film photovoltaics in its roof canopy, delivering 4W/m2 (Fies et al., 2007).
The Nellis solar power plant in Nevada was completed in December, 2007, on 140 acres, and is expected to generate 30 GWh per year. That’s 6W/m2 [5hzs5y].
Serpa Solar Power Plant, Portugal (PV), “the world’s most powerful solar power plant,” [39z5m5] [2uk8q8] has sun-tracking panels occupying 60 hectares, i.e., 600000m2 or 0.6km2, expected to generate 20 GWh per year, i.e., 2.3 MW on average. That’s a power per unit area of 3.8W/m2.
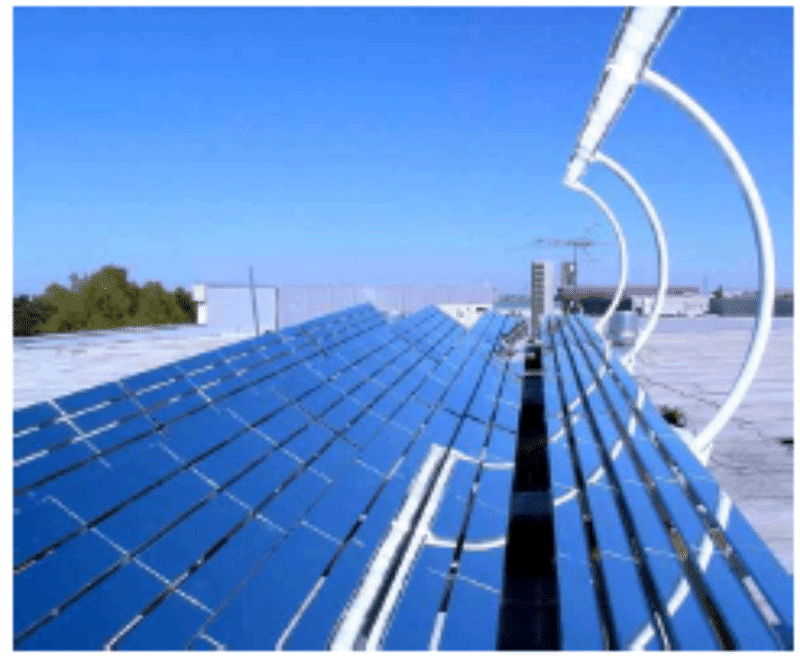
Figure 6.19: A combined-heat-and-power photovoltaic unit from Heliodynamics. A reflector area of 32m2 (a bit larger than the side of a double-decker bus) delivers up to 10 kW of heat and 1.5 kW of electrical power. In a sun-belt country, one of these one-ton devices could deliver about 60 kWh/d of heat and 9 kWh/d of electricity. These powers correspond to average fluxes of 80W/m2 of heat and 12W/m2 of electricity (that’s per square metre of device surface); these fluxes are similar to the fluxes delivered by standard solar heating panels and solar photovoltaic panels, but Heliodynamics’s concentrating design delivers power at a lower cost, because most of the material is simple flat glass. For comparison, the total power consumption of the average European person is 125 kWh/d.
The solar power capacity required to deliver 50 kWh/d per person in the UK is more than 100 times all the photovoltaics in the whole world. To deliver 50 kWh/d per person in the UK would require 125 GW average power, which requires 1250 GW of capacity. At the end of 2007, world installed photo-voltaics amounted to 10 GW peak; the build rate is roughly 2 GW per year.
...paving 5% of this country with solar panels seems beyond the bounds of plausibility. My main reason for feeling such a panelling of the country would be implausible is that Brits like using their countryside for farming and recreation rather than solar-panel husbandry. Another concern might be price. This isn’t a book about economics, but here are a few figures. Going by the price-tag of the Bavarian solar farm, to deliver 50 kWh/d per person would cost €91000 per person; if that power station lasted 20 years without further expenditure, the wholesale cost of the electricity would be €0.25 per kWh. Further reading: David Carlson, BP solar [2ahecp].
People in Britain throw away about 300 g of food per day. Source: Ventour (2008).
– Figure 6.10. In the USA, Miscanthus grown without nitrogen fertilizer yields about 24 t/ha/y of dry matter. In Britain, yields of 12–16 t/ha/y are reported. Dry Miscanthus has a net calorific value of 17 MJ/kg, so the British yield corresponds to a power density of 0.75W/m2. Sources: Heaton et al. (2004) and [6kqq77]. The estimated yield is obtained only after three years of undisturbed growing.
The most efficient plants are about 2% efficient; but the delivered power per unit area is about 0.5W/m2. At low light intensities, the best British plants are 2.4% efficient in well-fertilized fields (Monteith, 1977) but at higher light intensities, their conversion efficiency drops. According to Turkenburg (2000) and Schiermeier et al. (2008), the conversion efficiency of solar to biomass energy is less than 1%.
Here are a few sources to back up my estimate of 0.5W/m2 for vegetable power in the UK. The Royal Commission on Environmental Pollution’s estimate of the potential delivered power density from energy crops in Britain is 0.2W/m2 (Royal Commission on Environmental Pollution, 2004). The Royal Society’s biofuels document (Royal Society working group on biofuels, 2008), Miscanthus tops the list, delivering about 0.8W/m2 of chemical power.
In the World Energy Assessment published by the UNDP, Rogner (2000) writes: “Assuming a 45% conversion efficiency to electricity and yields of 15 oven dry tons per hectare per year, 2km2 of plantation would be needed per megawatt of electricity of installed capacity running 4,000 hours a year.” That is a power per unit area of 0.23W(e)/m2. (1 W(e) means 1 watt of electrical power.)
Energy for Sustainable Development Ltd (2003) estimates that short-rotation coppices can deliver over 10 tons of dry wood per hectare per year, which corresponds to a power density of 0.57W/m2. (Dry wood has a calorific value of 5 kWh per kg.)
According to Archer and Barber (2004), the instantaneous efficiency of a healthy leaf in optimal conditions can approach 5%, but the long-term energy-storage efficiency of modern crops is 0.5–1%. Archer and Barber suggest that by genetic modification, it might be possible to improve the storage efficiency of plants, especially C4 plants, which have already naturally evolved a more efficient photosynthetic pathway. C4 plants are mainly found in the tropics and thrive in high temperatures; they don’t grow at temperatures below 10∘C. Some examples of C4 plants are sugarcane, maize, sorghum, finger millet, and switchgrass. Zhu et al. (2008) calculate that the theoretical limit for the conversion efficiency of solar energy to biomass is 4.6% for C3 photo-synthesis at 30∘C and today’s 380 ppm atmospheric CO2 concentration, and 6% for C4 photosynthesis. They say that the highest solar energy conversion efficiencies reported for C3 and C4 crops are 2.4% and 3.7% respectively; and, citing Boyer (1982), that the average conversion efficiencies of major crops in the US are 3 or 4 times lower than those record efficiencies (that is, about 1% efficient). One reason that plants don’t achieve the theoretical limit is that they have insufficient capacity to use all the incoming radiation of bright sunlight. Both these papers (Zhu et al., 2008; Boyer, 1982) discuss prospects for genetic engineering of more-efficient plants.
Figure 6.11. The numbers in this figure are drawn from Rogner (2000) (net energy yields of wood, rape, sugarcane, and tropical plantations); Bayer Crop Science (2003) (rape to biodiesel); Francis et al. (2005) and Asselbergs et al. (2006) (jatropha); Mabee et al. (2006) (sugarcane, Brazil); Schmer et al. (2008) (switchgrass, marginal cropland in USA); Shapouri et al. (1995) (corn to ethanol); Royal Commission on Environmental Pollution (2004); Royal Society working group on biofuels (2008); Energy for Sustainable Development Ltd (2003); Archer and Barber (2004); Boyer (1982); Monteith (1977).
Even just setting fire to dried wood in a good wood boiler loses 20% of the heat up the chimney. Sources: Royal Society working group on biofuels (2008); Royal Commission on Environmental Pollution (2004).
NOTES / HIGHLIGHTS
Please Sign In to create your own Highlights / Notes
Notes/Highlights
Color
Highlighted Text
Notes
Please Sign In to create your own Highlights / Notes
Currently there are no resources to be displayed.
Description
This book explores six strategies for eliminating the gap between consumption and renewable production.


 FlexiA FREE Digital Tutor for Every Student
 FlexBooks 2.0Customizable, digital textbooks in a new, interactive platform
 FlexBooksCustomizable, digital textbooks
 SchoolsFlexBooks from schools and districts near you
 Study GuidesQuick review with key information for each concept
 Adaptive PracticeBuilding knowledge at each student’s skill level
 SimulationsInteractive Physics & Chemistry Simulations
 PLIXPlay. Learn. Interact. eXplore.
 CCSS MathConcepts and FlexBooks aligned to Common Core
 NGSSConcepts aligned to Next Generation Science Standards
 Certified EducatorStand out as an educator. Become CK-12 Certified.
 WebinarsLive and archived sessions to learn about CK-12