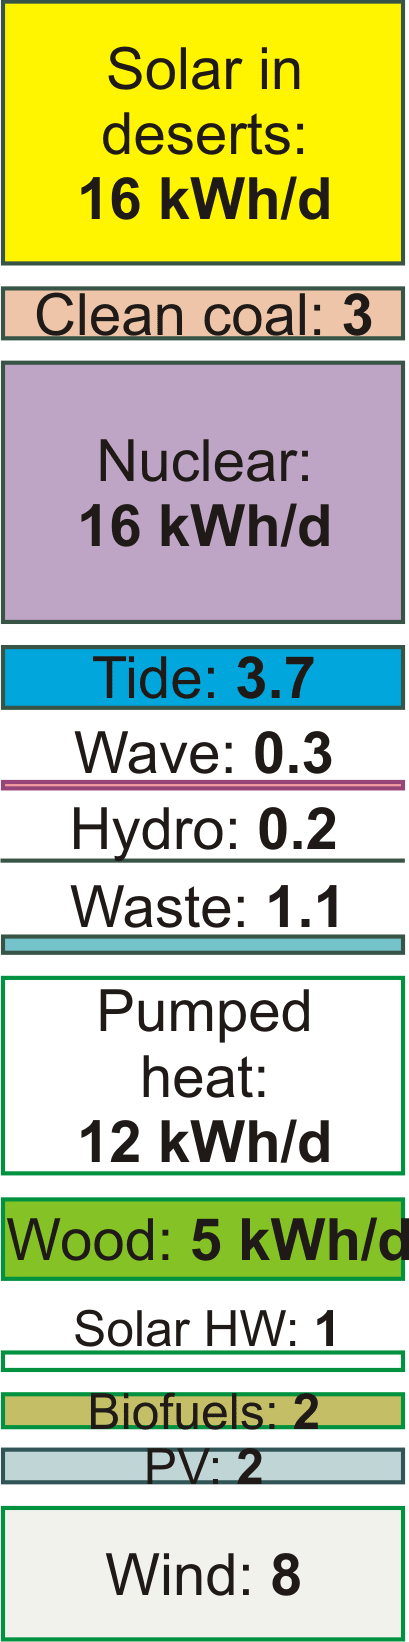
Let me try to make clear the scale of the previous chapter’s plans by showing you a map of Britain bearing a sixth plan. This sixth plan lies roughly in the middle of the first five, so I call it plan M (figure 28.1).
The areas and rough costs of these facilities are shown in table. For simplicity, the financial costs are estimated using today’s prices for comparable facilities, many of which are early prototypes. We can expect many of the prices to drop significantly. The rough costs given here are the building costs, and don’t include running costs or decommissioning costs. The “per person” costs are found by dividing the total cost by 60 million. Please remember, this is not a book about economics – that would require another 400 pages! I’m providing these cost estimates only to give a rough indication of the price tag we should expect to see on a plan that adds up.
I’d like to emphasize that I am not advocating this particular plan – it includes several features that I, as dictator of Britain, would not select. I’ve deliberately included all available technologies, so that you can try out your own plans with other mixes.
For example, if you say “photovoltaics are going to be too expensive, I’d like a plan with more wave power instead,” you can see how to do it: you need to increase the wave farms eight-fold. If you don’t like the wind farms’ locations, feel free to move them (but where to?). Bear in mind that putting more of them offshore will increase costs. If you’d like fewer wind farms, no problem – just specify which of the other technologies you’d like instead. You can replace five of the 100km2 wind farms by adding one more 1 GW nuclear power station, for example.
Perhaps you think that this plan (like each of the five plans in the previous chapter) devotes unreasonably large areas to biofuels. Fine: you may therefore conclude that the demand for liquid fuels for transport must be reduced below the 2 kWh per day per person that this plan assumed; or that liquid fuels must be created in some other way.
Cost of switching from fossil fuels to renewables
Every wind farm costs a few million pounds to build and delivers a few megawatts. As a very rough ballpark figure in 2008, installing one watt of capacity costs one pound; one kilowatt costs 1000 pounds; a megawatt of wind costs a million; a gigawatt of nuclear costs a billion or perhaps two. Other renewables are more expensive. We (the UK) currently consume a total power of roughly 300 GW, most of which is fossil fuel. So we can anticipate that a major switching from fossil fuel to renewables and/or nuclear is going to require roughly 300 GW of renewables and/or nuclear and thus have a cost in the ballpark of £300 billion. The rough costs in table add up to £870 bn, with the solar power facilities dominating the total – the photovoltaics cost £190 bn and the concentrating solar stations cost £340 bn. Both these costs might well come down dramatically as we learn by doing. A government report leaked by the Guardian in August 2007 estimates that achieving “20% by 2020” (that is, 20% of all energy from renewables, which would require an increase in renewable power of 80 GW) could cost “up to £22 billion” (which would average out to £1.7 billion per year). Even though this estimate is smaller than the £80 billion that the rule of thumb I just mentioned would have suggested, the authors of the leaked report seem to view £22 billion as an “unreasonable” cost, preferring a target of just 9% renewables. (Another reason they give for disliking the “20% by 2020” target is that the resulting greenhouse gas savings “risk making the EU emissions trading scheme redundant.” Terrifying thought!)
Figure 28.1: Plan M
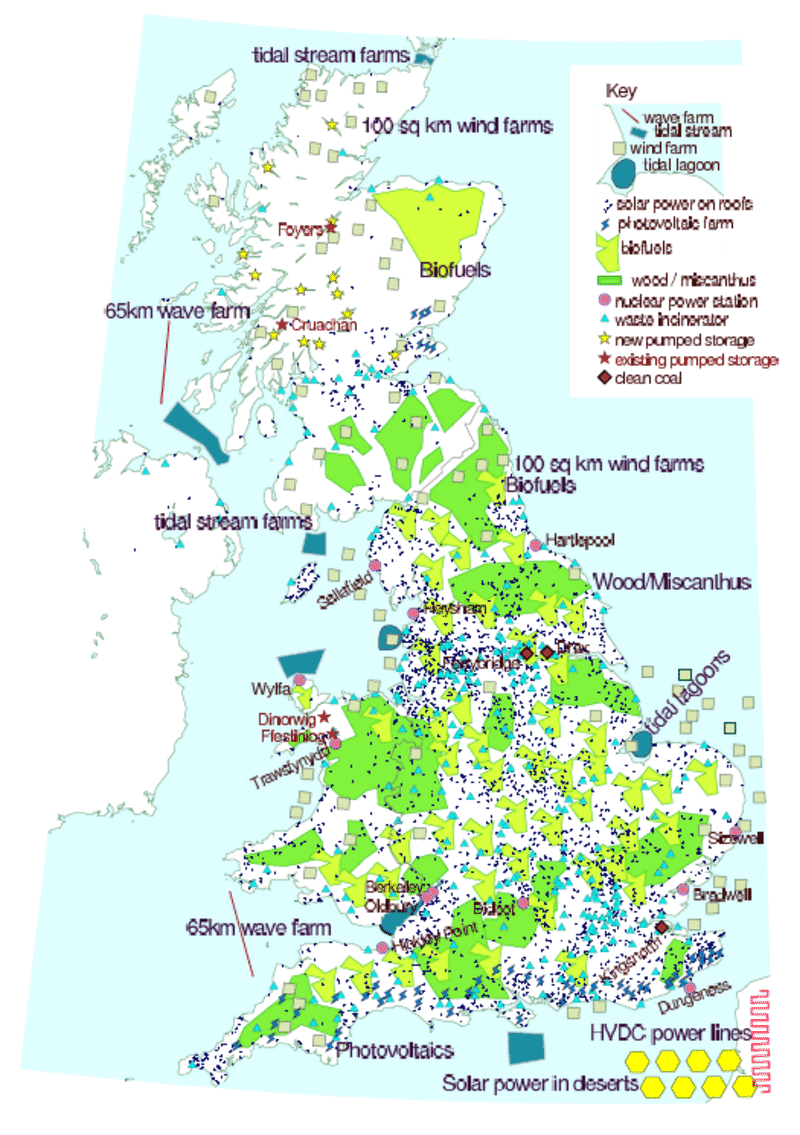
Figure 28.2: A plan that adds up, for Scotland, England, and Wales. The grey-green squares are wind farms. Each is 100km2 in size and is shown to scale. The red lines in the sea are wave farms, shown to scale. Light-blue lightning-shaped polygons: solar photovoltaic farms – 20km2 each, shown to scale. Blue sharp-cornered polygons in the sea: tide farms. Blue blobs in the sea (Blackpool and the Wash): tidal lagoons. Light-green land areas: woods and short-rotation coppices (to scale). Yellow-green areas: biofuel (to scale). Small blue triangles: waste incineration plants (not to scale). Big brown diamonds: clean coal power stations, with cofiring of biomass, and carbon capture and storage (not to scale). Purple dots: nuclear power stations (not to scale) – 3.3 GW average production at each of 12 sites. Yellow hexagons across the channel: concentrating solar power facilities in remote deserts (to scale, 335km2 each). The pink wiggly line in France represents new HVDC lines, 2000 km long, conveying 40 GW from remote deserts to the UK. Yellow stars in Scotland: new pumped storage facilities. Red stars: existing pumped storage facilities. Blue dots: solar panels for hot water on all roofs.
Capacity
Rough cost total
per person
Average power delivered
52 onshore wind farms: 5200km2
35 GW
£27bn
£450
4.2 kWh/d/p
–based on Lewis wind farm
29 offshore wind farms: 2900km2
29 GW
£36bn
£650
3.5 kWh/d/p
– based on Kentish Flats, & including £3bn investment in jack-up barges.
Pumped storage: 15 facilities similar to Dinorwig
30 GW
£15bn
£250
Photovoltaic farms: 1000km2
48 GW
£190bn
£3200
2 kWh/d/p
– based on Solarpark in Bavaria
Solar hot water panels: 1m2 of roof-mounted panel per person. (60km2 total) 2.5 GW(th) average
2.5 GW(th) average
£72bn
£1200
1 kWh/d/p
Waste incinerators: 100 new 30 MW incinerators
3 GW
£8.5bn
£140
1.1 kWh/d/p
– based on SELCHP
Heat pumps
210 GW(th)
£60bn
£1000
12 kWh/d/p
Wave farms – 2500 Pelamis, 130 km of sea
1.9 GW (0.76 GW average)
£6bn?
£100
0.3 kWh/d/p
Severn barrage: 550km2
8 GW (2 GW average)
£15bn
£250
0.8 kWh/d/p
Tidal lagoons: 800km2
1.75 GW average
£2.6bn?
£45
0.7 kWh/d/p
Tidal stream: 15000 turbines – 2000km2
18 GW (5.5 GW average)
£21bn?
£350
2.2 kWh/d/p
Nuclear power: 40 stations
45 GW
£60bn
£1000
16 kWh/d/p
– based on Olkiluoto, Finland
Clean coal
8 GW
£16bn
£270
3 kWh/d/p
Concentrating solar power in deserts: 2700km2
40 GW average
£340bn
£5700
16 kWh/d/p
– based on Solúcar
Land in Europe for 1600 km of HVDC power lines: 1200km2
50 GW
£1bn
£15
– assuming land costs £7500 per ha
2000 km of HVDC power lines
50 GW
£1bn
£15
– based on German Aerospace Center estimates
Biofuels: 30000km2
(cost not estimated)
2 kWh/d/p
Wood/Miscanthus: 31000km2
(cost not estimated)
5 kWh/d/p
Areas of land and sea required by plan M, and rough costs. Costs with a question mark are for technologies where no accurate cost is yet available from prototypes. “1 GW(th)” denotes one GW of thermal power.
Other things that cost a billion
Billions are big numbers and hard to get a feel for. To try to help put the cost of kicking fossil fuels into perspective, let’s now list some other things that also come in billions of pounds, or in billions per year. I’ll also express many of these expenditures “per person,” dividing the total by an appropriate population.
Perhaps the most relevant quantity to compare with is the money we already spend on energy every year. In the UK, the money spent on energy by final users is £75 billion per year, and the total market value of all energy consumed is £130 billion per year. So the idea of spending £1.7 billion per year on investment in future energy infrastructure seems not at all unreasonable – it is less than 3% of our current expenditure on energy!
Another good comparison to make is with our annual expenditure on insurance: some of the investments we need to make offer an uncertain return – just like insurance. UK individuals and businesses spend £90 bn per year on insurance.
Subsidies
£56 billion over 25 years: the cost of decommissioning the UK’s nuclear power stations. That’s the 2004 figure; in 2008 it was up to £73 billion (£1200 per person in the UK). [6eoyhg]
Transport
£4.3 billion: the cost of London Heathrow Airport’s Terminal 5. (£72 per person in the UK.)
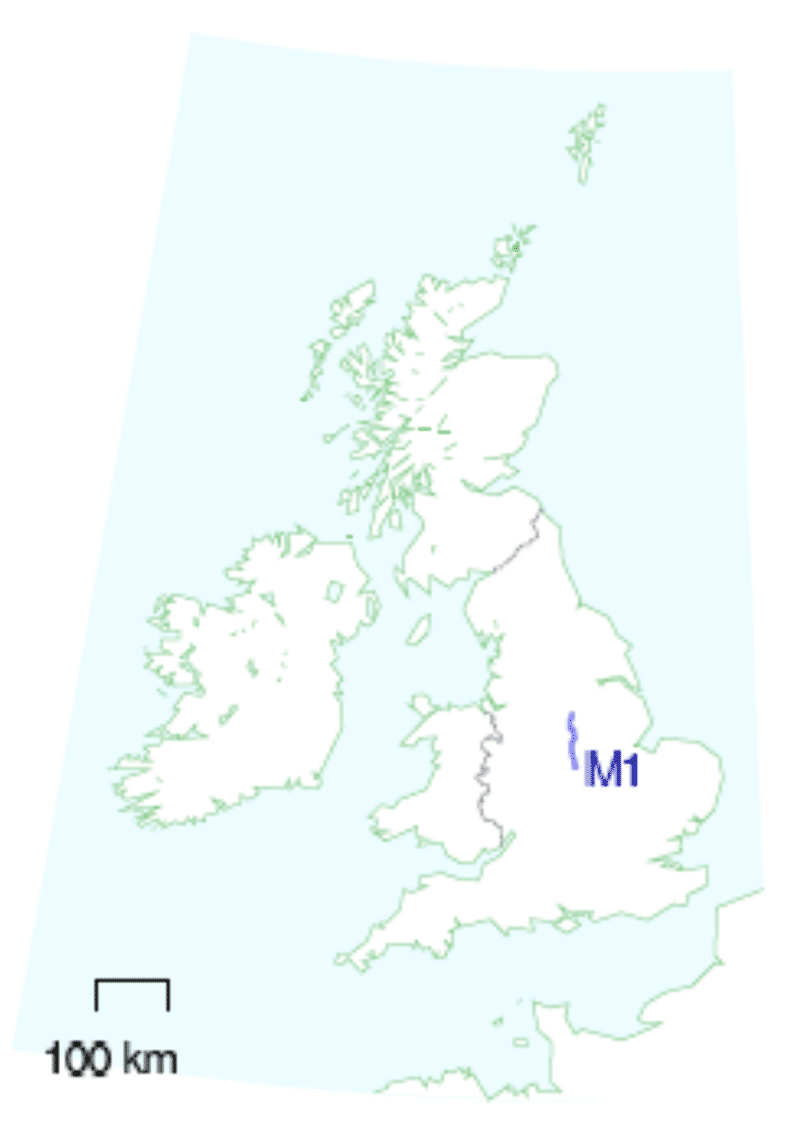
£1.9 billion: the cost of widening 91 km of the M1 (from junction 21 to 30, figure 28.4). [yu8em5]. (£32 per person in the UK.)
Figure 28.4: The M1, from junction 21 to 30.
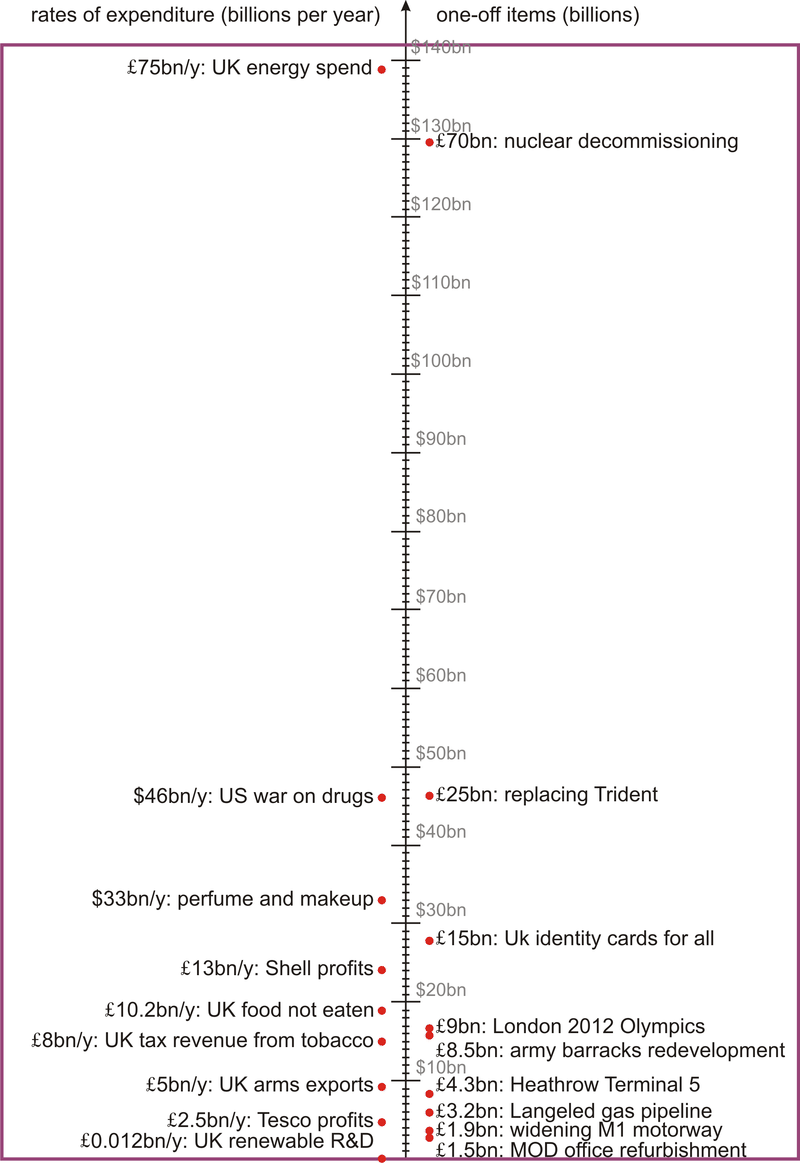
Figure 28.5: Things that run into billions. The scale down the centre has large ticks at $10 billion intervals and small ticks at $1 billion intervals.
Special occasions
Cost of the London 2012 Olympics: £2.4 billion; no, I’m sorry, £5 billion [3x2cr4]; or perhaps £9 billion [2dd4mz]. (£150 per person in the UK.)
Business as usual
£2.5 billion/y: Tesco’s profits (announced 2007). (£42 per year per person in the UK.)
£10.2 billion/y: spent by British people on food that they buy but do not eat. (£170 per year per person in the UK.)
£11 billion/y: BP’s profits (2006).
£13 billion/y: Royal Dutch Shell’s profits (2006).
$40 billion/y. Exxon’s profits (2006).
$33 billion/y. World expenditure on perfumes and make-up.
$700 billion per year: USA’s expenditure on foreign oil (2008). ($2300 per year per person in the USA.)
Government business as usual
£1.5 billion: the cost of refurbishment of Ministry of Defence offices. (Private Eye No. 1176, 19th January 2007, page 5.) (£25 per person in the UK.) £15 billion: the cost of introducing UK identity card scheme [7vlxp]. (£250 per person in the UK.)
Planning for the future
£3.2 billion: the cost of the Langeled pipeline, which ships gas from Norwegian producers to Britain. The pipeline’s capacity is 20 billion m3 per year, corresponding to a power of 25 GW. [6x4nvu] [39g2wz] [3ac8sj]. (£53 per person in the UK.)
Tobacco taxes and related games
£8 billion/y: annual revenue from tobacco taxes in the UK [y7kg26]. (£130 per year per person in the UK.) The European Union spends almost e1 billion a year subsidising tobacco farming. www.ash.org.uk
$46 billion/y: Annual cost of the USA’s “War on drugs.” [r9fcf] ($150 per year per person in the USA.)
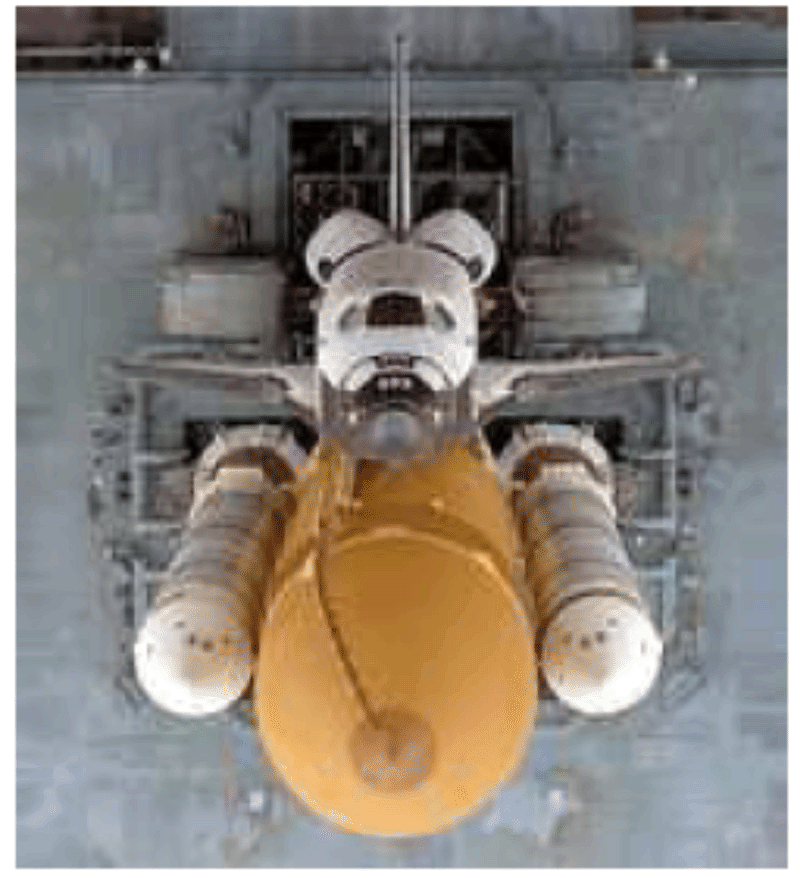
Space
$1.7 billion: the cost of one space shuttle. ($6 per person in the USA.)
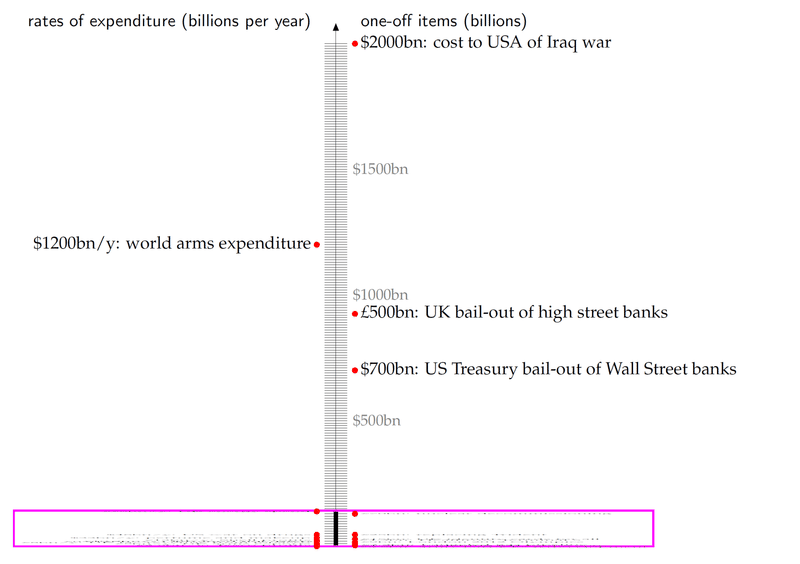
Figure 28.6: A few more things that run into billions. The vertical scale is squished 20-fold compared with the previous figure, figure 28.5, which is shown to scale inside the magenta box.
Banks
$700 billion: in October 2008, the US government committed $700 billion to bailing out Wall Street, and...
£500 billion: the UK government committed £500 billion to bailing out British banks.
Military
£5 billion per year: UK’s arms exports (£83 per year per person in the UK), of which £2.5 billion go to the Middle East, and £1 billion go to Saudi Arabia. Source: Observer, 3 December 2006.
£8.5 billion: cost of redevelopment of army barracks in Aldershot and Salis-bury Plain. (£140 per person in the UK.)
£3.8 billion: the cost of two new aircraft carriers (£63 per person in the UK). news.bbc.co.uk/1/low/scotland/6914788.stm
$4.5 billion per year: the cost of not making nuclear weapons – the US Department of Energy’s budget allocates at least $4.5 billion per year to “stockpile stewardship” activities to maintain the nuclear stockpile without nuclear testing and without large-scale production of new weapons. ($15 per year per person in America.)
£10–25 billion: the cost of replacing Trident, the British nuclear weapon system. (£170–420 per person in the UK.) [ysncks].
$63 billion: American donation of “military aid” (i.e. weapons) to the Middle East over 10 years – roughly half to Israel, and half to Arab states. [2vq59t] ($210 per person in the USA.)
$1200 billion per year: world expenditure on arms [ym46a9]. ($200 per year per person in the world.)
$2000 billion or more: the cost, to the USA, of the [99bpt] Iraq war according to Nobel prize-winning economist Joseph Stiglitz. ($7000 per person in America.)
According to the Stern review, the global cost of averting dangerous climate change (if we act now) is $440 billion per year ($440 per year per person, if shared equally between the 1 billion richest people). In 2005, the US government alone spent $480 billion on wars and preparation for wars. The total military expenditure of the 15 biggest military-spending countries was $840 billion.
Expenditure that doesnotrun into billions
£0.012 billion per year: the smallest item displayed in figure 28.5 is the UK government’s annual investment in renewable-energy research and development. (£0.20 per person in the UK, per year.)
Notes and further reading
Figure 28.2. I’ve assumed that the solar photovoltaic farms have a power per unit area of 5W/m2, the same as the Bavaria farm, so each farm on the map delivers 100 MW on average. Their total average production would be 5 GW, which requires roughly 50 GW of peak capacity (that’s 16 times Germany’s PV capacity in 2006). The yellow hexagons representing concentrating solar power have an average power of 5 GW each; it takes two of these hexagons to power one of the “blobs” of Chapter Living on other countries' renewables?.
A government report leaked by the Guardian... The Guardian report, 13th August 2007, said [2bmuod] “Government officials have secretly briefed ministers that Britain has no hope of getting remotely near the new European Union renewable energy target that Tony Blair signed up to in the spring - and have suggested that they find ways of wriggling out of it.”
The leaked document is at [3g8nn8].
perfume... Source: Worldwatch Institute
www.worldwatch.org/press/news/2004/01/07/
wars and preparation for wars... www.conscienceonline.org.uk
Government investment in renewable-energy-related research and development. In 2002–3, the UK Government’s commitment to renewable-energy-related R&D was £12.2 million. Source: House of Lords Science and Technology Committee, 4th Report of Session 2003–04. [3jo7q2]
Comparably small is the government’s allocation to the Low Carbon Buildings Programme, £0.018bn/y shared between wind, biomass, solar hot water/PV, ground-source heat pumps, micro-hydro and micro CHP.
NOTES / HIGHLIGHTS
Please Sign In to create your own Highlights / Notes
Notes/Highlights
Color
Highlighted Text
Notes
Please Sign In to create your own Highlights / Notes
Currently there are no resources to be displayed.
Description
This book explores six strategies for eliminating the gap between consumption and renewable production.


 FlexiA FREE Digital Tutor for Every Student
 FlexBooks 2.0Customizable, digital textbooks in a new, interactive platform
 FlexBooksCustomizable, digital textbooks
 SchoolsFlexBooks from schools and districts near you
 Study GuidesQuick review with key information for each concept
 Adaptive PracticeBuilding knowledge at each student’s skill level
 SimulationsInteractive Physics & Chemistry Simulations
 PLIXPlay. Learn. Interact. eXplore.
 CCSS MathConcepts and FlexBooks aligned to Common Core
 NGSSConcepts aligned to Next Generation Science Standards
 Certified EducatorStand out as an educator. Become CK-12 Certified.
 WebinarsLive and archived sessions to learn about CK-12