


Every day, we make quick judgments based on how things feel: a glass of lemonade feels colder in a metal cup than in a plastic cup, a heavy ball feels like it should fall faster than a light one, and a bigger object feels like it will sink faster than a smaller one. Feelings are a good starting point, but they can be wrong or uneven. Science helps us turn these first impressions into fair tests that anyone can repeat and check.

Think about the terrace activity with two cards, one black and one white. If we simply touch them once and declare, “black is hotter,” we have more questions than answers. Were the cards the same size and material? Did both sit in the same sunlight for the same time? Did we measure temperature or just guess? The scientific method answers these doubts.
Steps Involved in the Scientific Method
Science goes beyond simply memorising information or conducting experiments. It involves following a systematic approach that guides us toward finding solutions to our inquiries. The following are the steps that make up this process:
1. Observe
A scientific journey starts when something puzzles us or we notice something interesting. An observation is a careful noticing - “the black card seems hotter.”
2. Ask a Testable Question:
We convert the observation into a testable question. A testable question is specific, measurable, and safe to investigate.
Example: Under identical conditions, does a black card reach a higher temperature than a white card?
3. Create a Hypothesis
A hypothesis is a clear, testable guess that guides what to change and what to measure.
Example: If a surface is black, it will absorb more sunlight and reach a higher temperature than a white surface placed beside it.
4. Identify the Variables and Plan a Fair Test
A variable is anything that can change in an experiment.
- The independent variable is what you change on purpose (for example, colour: black vs. white).
- The dependent variable is what you measure (for example, temperature at each time).
- Control variables are factors that are kept constant or limited during an experiment to prevent them from influencing the relationship between the independent and dependent variables. They are not the primary focus of the study, but they are controlled to ensure that any observed changes in the dependent variable are due to the manipulation of the independent variable and not other extraneous factors (for example, card size and material, place, time of day, instrument, interval).
A fair test means changing only one factor at a time, so you can reasonably link any difference in results to that one change. Decide what you change (colour), what you measure (temperature), and what you keep the same (size, material, place, time, instrument).
5. Measure and Record
Decide duration (e.g., 20 minutes), reading interval (every 5 minutes), and location (same spot, away from shadows and reflective glass). Take readings at regular intervals with proper units (degrees Celsius (@$\begin{align*}^\circ \text{C}\end{align*}@$) and minutes.), do multiple trials to build reliability and write neat tables.
| Time (in @$\begin{align*}\text{min}\end{align*}@$) | Temp. of Black Card (in@$\begin{align*}^\circ \text{C}\end{align*}@$) | Temp. of White Card (in@$\begin{align*}^\circ \text{C}\end{align*}@$) |
| 0 | ||
| 5 | ||
| 10 | ||
| 15 | ||
| 20 |
Team up and work in pairs - one reads the thermometer while the other writes values because science is often collaborative and more fun together.
6. Analyse
After filling the table, look for patterns, calculate differences, averages, or rates (temperature rise per minute).
Example: “At 15 min, the black card is @$\begin{align*}6^\circ\text{C}\end{align*}@$hotter"
7. Conclude
Write a conclusion that uses the numbers to answer the original question. A conclusion must answer the original question using numbers, not opinions.
Example: Black stayed @$\begin{align*}6-8^\circ\text{C}\end{align*}@$ hotter at each reading, so a black card reaches a higher temperature than a white card.
If your results disagree with your hypothesis, that is not failure. It is an invitation to revise the hypothesis or method.
8. Communicate and Improve
Share what you did, how you measured, and what you found so others can repeat the investigation and check your claim. Suggest improvements (more trials, better shade control, different times of day) and test again.
|
||
Examples of Scientific Method
Example 1:
Read each everyday scenario. For each, decide whether the person is following the scientific method. Give a brief reason.
1. T-Shirt Claim: A friend says “Black T-shirts are hotter in summer because I can feel it.”
2. Toy Car and Surface: A toy car is released (no push) from the same start line from the same ramp on tiles and on a doormat. Distance is measured with a tape in 5 trials each, then averages are compared.
3. Paper Towel Absorbency: Towels of Brand A and Brand B are dipped in water for 5 seconds, but sheet sizes are different. Wet mass is measured and Brand A “wins.”
4. Drying Rate (Fan vs Still Air): Two identical handkerchiefs are soaked to the same start mass. One is hung under a fan, one in still air. After 25 minutes, both are weighed; mass loss per minute is calculated and compared.
5. Pendulum Timing: A student tests “length affects time” but changes length and release angle each trial. They time 10 swings once per length and conclude longer means slower.
1. T-Shirt Claim: No. It relies on a feeling rather than a testable question, measurements, or controls. Without same-fabric shirts, timed exposure, and temperature readings, it isn’t a fair, evidence-based test.
2. Toy Car and Surface: Yes. The independent variable is surface type, the dependent variable is distance, and controls include the same car and release method. Multiple trials and an average make the result reliable and evidence-based.
3. Paper Towel Absorbency: No. Different sheet sizes violate control of sample area, so the outcome can’t be linked to brand alone. Without equal area and identical dip/drip timing, the comparison isn’t fair.
4. Drying Rate (Fan vs Still Air): Yes. Both cloths begin with the same mass and run for the same time, and the analysis uses a rate (grams per minute). Side-by-side placement and units make the evidence clear.
5. Pendulum Timing: No. Two variables (length and release angle) change at once, and timings are single-trial. That breaks fairness and reliability, so the result doesn’t test the question properly.
| Summary of Scientific Method |
1. Observe 2. Ask a Testable Question 3. Create a Hypothesis 4. Identify Variables and Plan a Fair Test - Independent variable: What you deliberately change Fair Test: Change only one factor at a time so results can be clearly linked to that single change. 5. Measure and Record 6. Analyse 7. Conclude 8. Communicate and Improve |
Review Questions of Scientific Method
- In your own words, explain how a question is different from a hypothesis. Give a school-based example for each.
- Convert the curiosity “the fan cools the room quickly” into a testable question and list one independent, one dependent, and two control variables.
- Suggest a fair test to check whether a black T-shirt heats faster than a light-coloured T-shirt in sunlight. What will you measure and how often?
- Your results do not support your hypothesis. What should you do next, and why is this still good science?
- Describe how you would keep a test fair when comparing how far a toy car rolls on two different classroom surfaces.
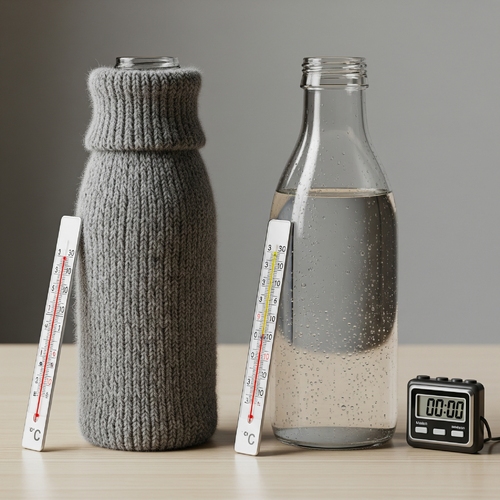
- Write one observation, one question, and one hypothesis related to keeping rotis warm in a lunch box.
|
||||||||||||||||||
| Image | Reference | Attributions |
|---|