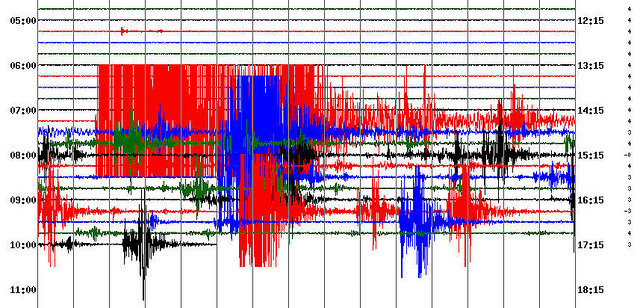
What information can you pick out of this seismograph? Can you see arrival of the P- and S-waves? How many earthquakes were there? Were there foreshocks or aftershocks? At what times do all of these things happen?
Measuring Magnitude
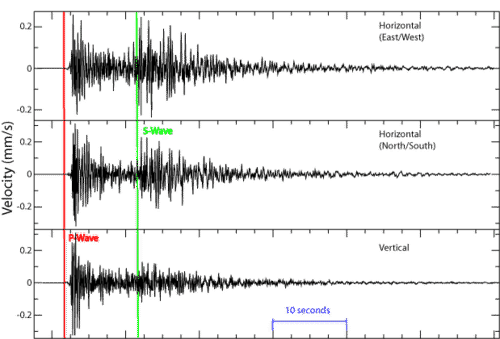
A seismograph produces a graph-like representation of the seismic waves it receives and records them onto a seismogram (Figurebelow). Seismograms contain information that can be used to determine how strong an earthquake was, how long it lasted, and how far away it was. Modern seismometers record ground motions using electronic motion detectors. The data are then kept digitally on a computer.
These seismograms show the arrival of P-waves and S-waves. The surface waves arrive just after the S-waves and are difficult to distinguish. Time is indicated on the horizontal portion (or x-axis) of the graph.
If a seismogram records P-waves and surface waves but not S-waves, the seismograph was on the other side of the Earth from the earthquake. The amplitude of the waves can be used to determine the magnitude of the earthquake, which will be discussed in a later section.
Interpreting a Seismogram
The seismogram in the introduction shows:
foreshocks.
the arrival of the P-waves.
the arrival of the S-waves.
the arrival of the surface waves (very hard to pick out).
aftershocks.
the times when all of these things occur.
Summary
A seismograph records seismic waves on a seismogram. A seismometer is a digital seismic wave recorder.
Since S-waves do not travel through liquids, a seismogram with no S-waves is on the other side of the planet.
Seismographs yield a tremendous amount of information about an earthquake.
Review
Define seismograph, seismogram, and seismometer.
What does a seismogram with P-waves but not S-waves mean?
How can you tell a main earthquake from foreshocks and aftershocks?
Explore More
Use this resource (start at 06:30) to answer the questions that follow.
What is the Mercalli Scale?
What happens at level IX?
What does the Richter Scale measure?
What is the most damaging quake on this scale?
What does each step of the Richter scale represent in energy increase.
In our historical experience what releases the most energy: earthquakes, volcanic eruptions or atomic bombs?
How often do we have earthquake of magnitude 8 and above?
What does the Moment Magnitude scale measure?
Where is the epicenter of an earthquake?
How do you calculate the epicenter of an earthquake?
Vocabulary
termdefinition
seismogramprinted record of seismic activity produced by a seismometer.
seismographan older type of seismometer in which a suspended, weighted pen wrote on a drum that moved with the ground.
seismometerequipment that measures seismic waves and other ground motions.
Notes/Highlights
Color
Highlighted Text
Notes
Please Sign In to create your own Highlights / Notes


 FlexiA FREE Digital Tutor for Every Student
 FlexBooks 2.0Customizable, digital textbooks in a new, interactive platform
 FlexBooksCustomizable, digital textbooks
 SchoolsFlexBooks from schools and districts near you
 Study GuidesQuick review with key information for each concept
 Adaptive PracticeBuilding knowledge at each student’s skill level
 SimulationsInteractive Physics & Chemistry Simulations
 PLIXPlay. Learn. Interact. eXplore.
 CCSS MathConcepts and FlexBooks aligned to Common Core
 NGSSConcepts aligned to Next Generation Science Standards
 Certified EducatorStand out as an educator. Become CK-12 Certified.
 WebinarsLive and archived sessions to learn about CK-12