Scatter Plots and Linear Correlation

Plot points and estimate the line that best represents them

Braingenie Logo
Braingenie Logo
Concept Map
Discover related concepts in Math and Science.
CK-12 ContentCommunity Content
VIEW ALL
CREATE
We have provided many ways for you to learn about this topic.
Create your own content
Read
Plotting a Scatterplot and Finding the Equation of Best Fit
at grade10 11 12
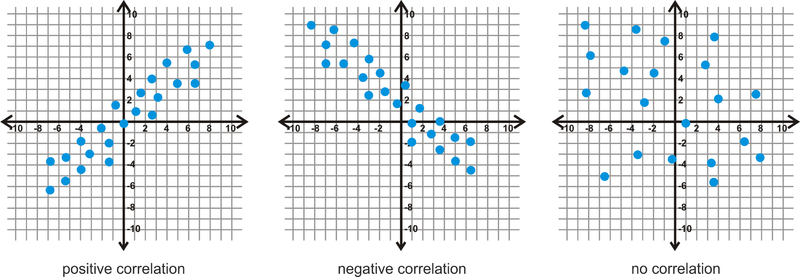
This lesson covers plotting a scatterplot and finding a linear equation that best fits the data.
PLIX
Regression and Correlation
at grade
Regression and Correlation Interactive
Video
Graphical Interpretation of a Scatter Plot and Line of Best Fit
basic
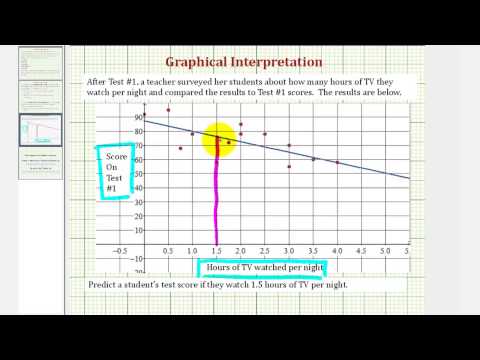
Explains how to use the graph of a scatter plot and line of best fit to make a prediction.
Real World
Global Warming
at grade8
Learn how meteorologists use scatterplots to detect trends in climate.
Please wait...
Please wait...