 AI Teacher Tools


Displaying Categorical Variables
Visually displaying categorical data using bars or sectors of a circle

Read
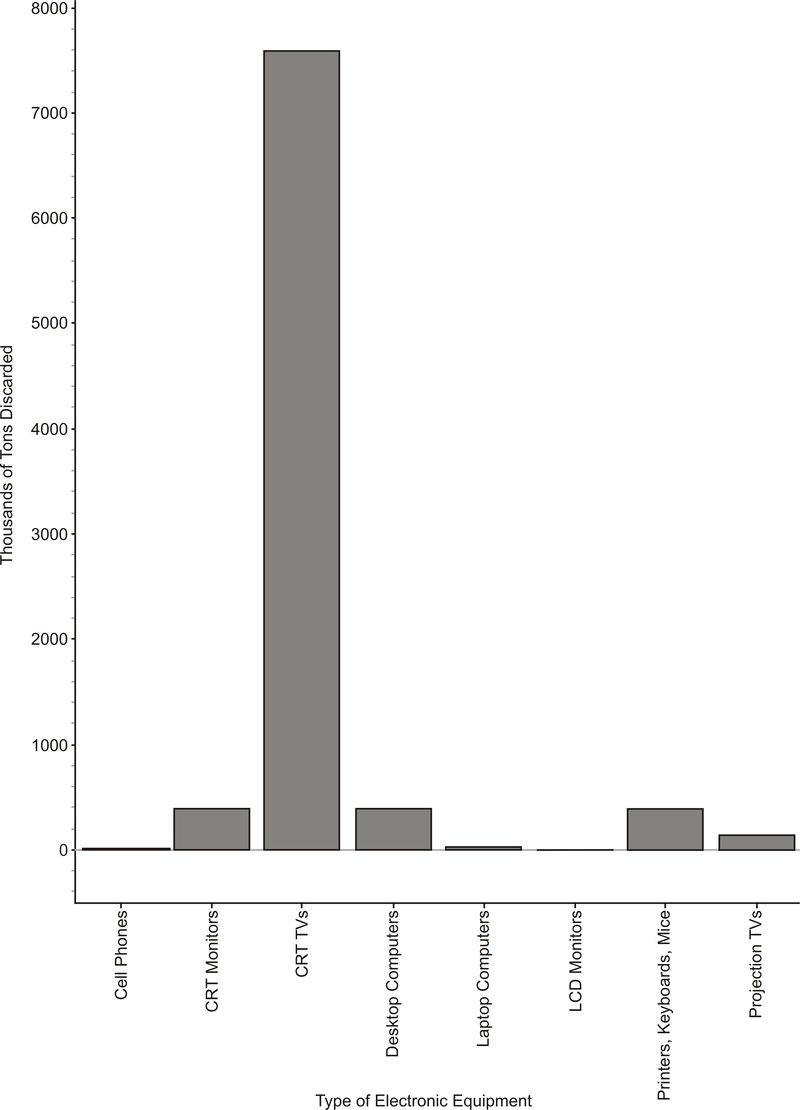
This Concept covers a few ways in which categorical data can be displayed; using bar graphs and pie
PLIX
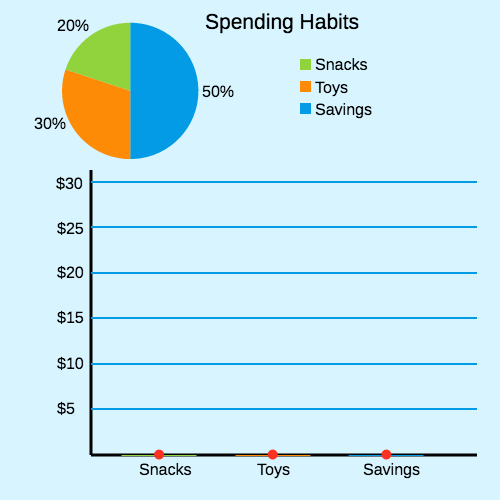
Circle Graphs to Make Bar Graphs: Spending Habits Interactive